
Acquisition Financial Model: Build It Step-by-Step
Acquisition Financial Model: Build It Step-by-Step

An acquisition financial model is a decision spreadsheet that tests whether a buyout can service its debt, return capital, and survive post-close integration. For a small-business deal, a common SBA 7(a) structure can involve up to $5 million in debt, about 10% buyer equity, a seller note of roughly 10% to 15%, and the remaining 75% to 80% financed by the loan.
You're reviewing a target that looks attractive on the surface. The seller's earnings appear strong, the purchase price seems supportable, and a lender has indicated that financing may be available. Then the questions become more uncomfortable. What happens when a key employee leaves, receivables arrive late, the new owner has to replace software, and the promised cost savings take longer than expected?
That's where an acquisition financial model earns its keep. It isn't a valuation worksheet designed to make the purchase price look reasonable. It's a deal-survival tool that connects operating performance, working capital, financing, integration, liquidity, and investor returns in one traceable system.
Table of Contents
- What an Acquisition Financial Model Actually Solves
- How to Set Assumptions Before You Price the Deal
- Sources, Uses, and Transaction Adjustments
- Building the Debt Schedule and Return Waterfall
- Stress-Testing for Tight Credit and Integration Risk
- Investor-Ready Outputs and Template Guidance
What an Acquisition Financial Model Actually Solves
The usual buyer trap is starting with the asking price and working backward until the deal appears financeable. A stronger process starts with the business's ability to produce cash after closing. The model should tell you whether the company can pay lenders, preserve enough liquidity to operate, and still create an acceptable return if integration takes longer than planned.
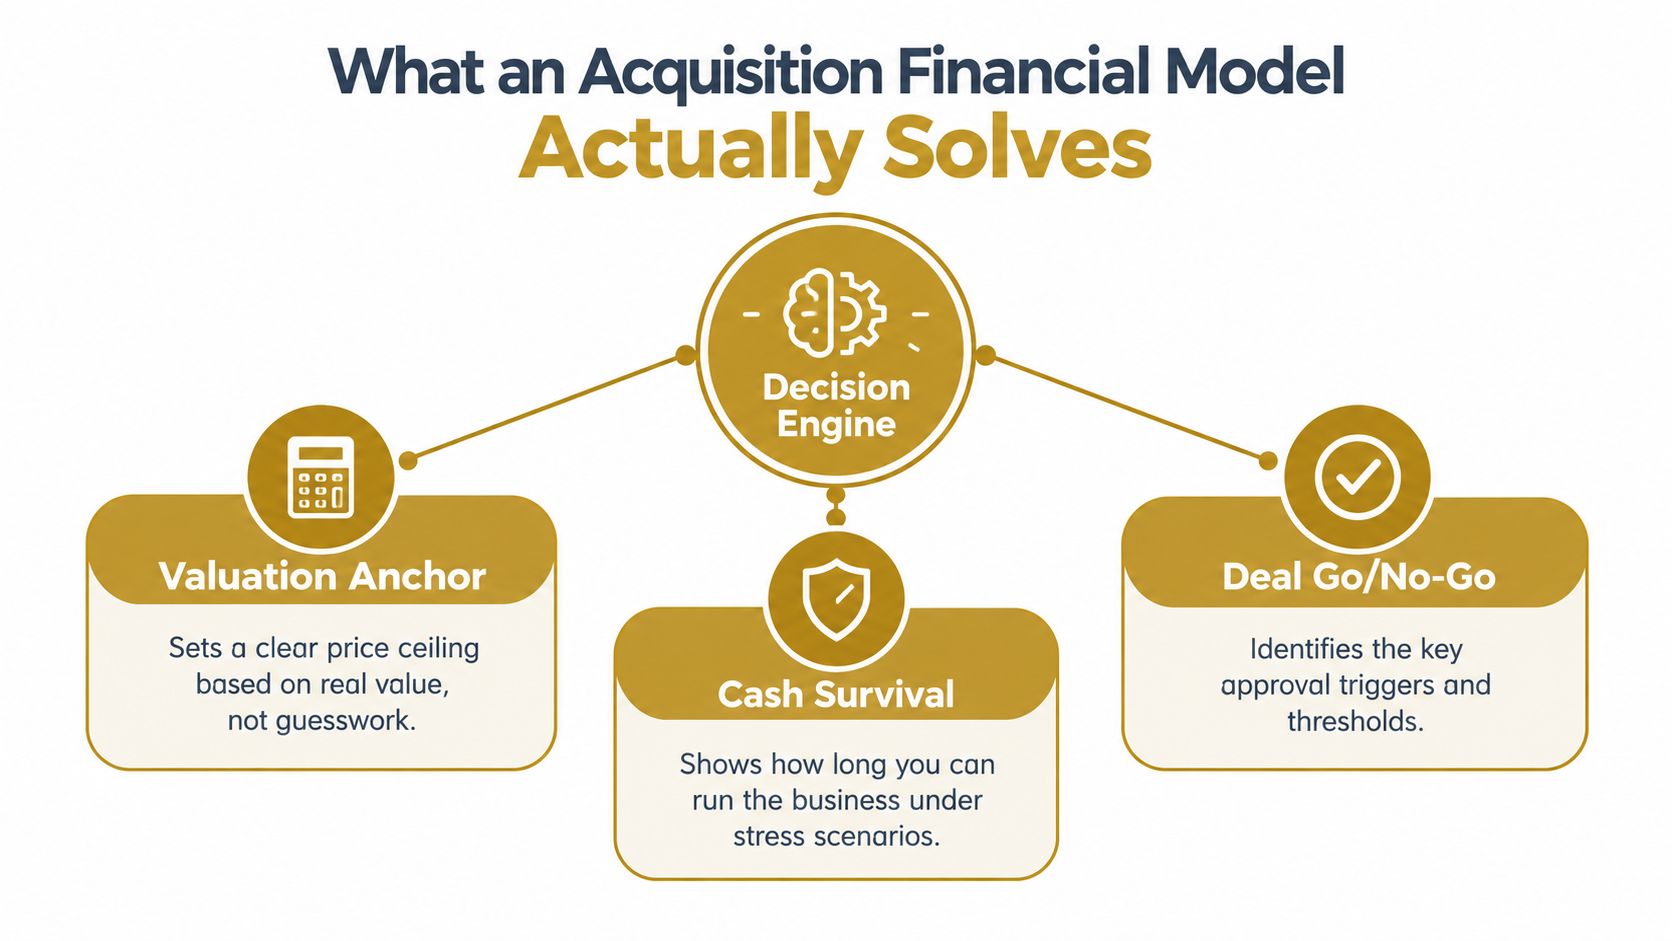
Treat the model as a decision engine
Build the workbook in linked layers rather than as one giant forecast:
- Historical normalization: Reconstruct the target's revenue, gross profit, operating expenses, owner compensation, capital expenditure, working capital, and cash generation.
- Operating forecast: Project the business under a base case, upside case, and downside case. Each scenario should be driven by operating assumptions, not arbitrary percentage changes.
- Financing schedule: Model each debt tranche, interest burden, amortization, mandatory repayment, optional repayment, and covenant test.
- Transaction reconciliation: Connect sources and uses, pro forma statements, coverage, equity contributions, and return calculations.
- Risk outputs: Show the conditions that cause a covenant breach, liquidity shortfall, repricing, or investment committee rejection.
The financing mix can change the conclusion even when the target and purchase price remain unchanged. Historical LBO structures in the 1980s often used approximately 80% debt and 20% equity, while later structures moved closer to 60% debt and 40% equity as lenders and markets became more conservative, as described in this overview of acquisition financing structures. A highly levered structure can magnify equity returns when operations improve, but it also leaves less room for revenue or margin weakness.
Match the model to the deal type
An LBO-style control acquisition emphasizes debt paydown, cash conversion, exit value, and the equity return waterfall. A minority partnership needs more attention on ownership rights, distribution policy, dilution, and the circumstances in which an investor can exit. A creative SMB structure may combine bank debt, seller financing, rollover equity, earn-outs, or contingent payments.
Those structures aren't interchangeable. A target that looks compelling under heavy borrowing may become unattractive when the buyer contributes more equity. Conversely, a conservative capital stack may reduce headline returns while giving the operator enough flexibility to survive a difficult first year.
Practical rule: The model isn't finished when it produces an attractive IRR. It's finished when you can explain exactly which operating and financing conditions protect or destroy that return.
How to Set Assumptions Before You Price the Deal
Assumptions should come from evidence in the target's records, not from the seller's preferred presentation. Start by importing the historical income statement, balance sheet, cash flow statement, customer concentration, payroll records, tax filings, debt agreements, and working-capital detail into a controlled assumptions area.
Then normalize the earnings. Remove non-recurring expenses, replace owner compensation with the cost of the role the buyer will need to fill, separate personal expenses from business costs, and test every add-back against bank statements or source documentation. SME targets can show reported EBITDA 30% to 40% below or above true operating performance after adjustments, and seller-side recasts can overstate SDE by 20% to 35% compared with what an SBA underwriter will accept, according to independent SMB acquisition finance guidance.
Build an assumption hierarchy
Use three levels of confidence:
- Documented inputs: Revenue from bank deposits, payroll from payroll records, debt service from loan documents, and recurring vendor costs from invoices.
- Underwritten adjustments: Replacement owner salary, normalized rent, recurring maintenance spending, and expenses that the seller calls discretionary but the business clearly needs.
- Execution assumptions: Customer retention, pricing changes, cross-sell, hiring speed, integration savings, and new sales capacity.
The third category deserves the most skepticism. A seller may describe a vacant sales role as an opportunity, but your model should carry the hiring cost and the time needed for a new employee to become productive. A buyer may expect to remove duplicate software, yet the model should include the transition cost and the possibility that both systems remain active during migration.
Your working-capital schedule must also be operational, not decorative. Tie receivables to collection behavior, inventory to purchasing requirements, and payables to actual supplier terms. A business can show attractive EBITDA while cash is trapped in receivables or inventory.
Let financing reality shape the forecast
Build base, upside, and downside cases before selecting a loan amount. In the downside case, reduce the assumptions that are most vulnerable to execution, such as new-customer growth, cross-sell, margin expansion, and fast hiring. Keep unavoidable costs visible.
A useful model also includes trigger cells. For example, flag the deal when debt service consumes too much available cash, when the minimum cash balance falls below the buyer's operating buffer, or when a required synergy becomes necessary to avoid a covenant problem. A structured financial due diligence checklist for acquisition buyers helps connect those tests to the documents being reviewed.
Clear documentation improves review quality and can improve bank decision-making, because the lender can distinguish verified historical performance from buyer judgment. Don't hide uncertainty inside a single blended growth rate. Label each driver, record its source, and show what changes when the assumption is wrong.
Sources, Uses, and Transaction Adjustments
A sources-and-uses schedule is the point where the financing story meets the cash required to close. Sources must equal uses, but that basic check isn't enough. A transaction can balance perfectly at closing and still leave the buyer unable to fund payroll, integration, inventory, or debt service afterward.

Build the closing bridge
List every use of cash separately:
- Purchase consideration: Cash paid to the seller, assumed liabilities, seller note, earn-out, or rollover equity.
- Refinancing: Existing debt payoff, equipment loans, shareholder loans, and any lien releases required at closing.
- Transaction costs: Legal, accounting, lender, diligence, broker, insurance, and financing fees.
- Balance-sheet adjustments: Agreed cash retained by the seller, normalized working capital, inventory adjustments, and debt-like items.
- Post-close liquidity: Cash reserved for payroll, integration, seasonal needs, and unexpected operating pressure.
The capital stack should reflect how small-business acquisitions are actually financed. Under the SBA 7(a) framework, a buyer may use up to $5 million in debt, with a structure that often includes about 10% buyer equity, a seller note of roughly 10% to 15%, and 75% to 80% financed by the 7(a) loan, as outlined in research on the U.S. SBA 7(a) loan program%20Loan%20Program.pdf). The point isn't to copy that structure blindly. The point is to model how equity injection, seller financing, amortization, and coverage interact.
Translate closing adjustments into operations
After sources and uses, create the pro forma opening balance sheet. Show which liabilities disappear, which debt remains, what new debt is added, how fees are treated, and what cash the buyer controls.
Working capital deserves its own reconciliation. If the seller delivers less inventory than agreed, the buyer may need immediate cash to restore operating levels. If customer deposits transfer with the business, they may represent an obligation rather than free cash. If the transaction assumes a normalized receivables balance, the model must show how long the buyer waits to collect it.
SME acquisitions are also more likely to use equity financing than larger-firm deals, according to the research linked above. That reinforces a practical point: deal size and buyer profile influence the appropriate capital stack. A bank-only structure may not be realistic, while an all-cash purchase can consume the liquidity needed to operate.
The cash left in the business after closing is part of the purchase decision. Don't treat it as an afterthought.
Building the Debt Schedule and Return Waterfall
Debt schedules reveal whether the operating forecast can carry the transaction. Start with a separate row for each tranche. Record opening balance, new borrowing, mandatory amortization, optional repayment, interest expense, closing balance, priority, maturity, and covenant treatment.
Use the actual timing of the transaction. Debt drawn at closing doesn't produce the same interest pattern as debt drawn later for integration or an add-on. Seller notes may have different payment dates and subordination rules. A revolving facility may provide liquidity but also create fees, borrowing-base limits, or lender approval requirements.
Connect debt to cash, not just EBITDA
A P&L-only model can show a profitable company while the bank account declines. Build a combined 13-week cash forecast and 24-month scenario model that includes integration costs, working-capital swings, and debt service, following the practical acquisition cash-management guidance at this acquisition finance resource.
The near-term forecast should track receipts and disbursements by week. Include payroll, taxes, rent, supplier payments, debt service, professional fees, technology changes, customer credits, and one-time transition costs. The longer scenario model should show how the opening liquidity position changes as the business moves from closing to stabilized operations.
The reason for this level of detail is simple. Integration expenses often arrive before expected synergies. Receivables can lag after customer transitions. A profitable month may still produce negative cash flow if inventory purchases or debt payments fall at the wrong time.
Separate operating value from financing value
The return waterfall should explain how equity value is created:
- Begin with the buyer's equity contribution, including transaction funding and any required reserve.
- Show operating cash flow after taxes, capital expenditure, working capital, and debt service.
- Apply permitted cash distributions only after required liquidity and debt obligations are satisfied.
- Track principal paydown as a source of increasing equity value.
- At exit, calculate enterprise value, subtract remaining debt and transaction costs, then allocate proceeds according to ownership and preferred-return rules.
Keep IRR, MOIC, and cash-on-cash return in separate outputs. A high IRR may result from an early distribution, while a strong multiple may depend on a distant exit. Neither output replaces the cash schedule.
Buyers reviewing different funding options can use this guide to financing options for acquisitions as a starting point, but the model must still reflect the specific terms negotiated for the target. Generic financing labels conceal the details that determine survival, especially amortization, subordination, prepayment, and covenants.
Stress-Testing for Tight Credit and Integration Risk
A credible model should be designed to fail in controlled ways. Start with the lender's constraints, then test the operating assumptions that support repayment. Higher financing costs, tighter documentation, smaller equity cushions, and limited covenant room can turn a modest forecast miss into a restructuring problem.
Neutral 2025 coverage describes restrictive financed conditions, growing private credit, stronger lender protections, and greater flexibility for add-on acquisitions than for large standalone buyouts. In SMB lending, the average SBA 7(a) acquisition loan reached $1.18 million in FY2025, while acquisition lending totaled $8.29 billion across 7,003 loans. The same coverage identifies the standard 10% equity injection and 1.25x coverage floor as hard constraints, as reported in this 2025 leveraged finance analysis.
Run deliberate break cases
Don't rely on one sensitivity table. Use separate tests for separate risks:
- Rate stress: Increase the cost of debt and measure the effect on interest, cash flow, coverage, and optional repayment.
- Revenue stress: Delay new customer wins, reduce retention, or create a temporary revenue gap during customer handoff.
- Margin stress: Remove assumed pricing gains or delay purchasing and labor efficiencies.
- Liquidity stress: Extend receivable collection, increase inventory needs, and pull integration costs forward.
- Debt stress: Reduce available borrowing capacity or assume mandatory amortization continues while cash generation weakens.
- Exit stress: Lower the exit value assumption and test whether the equity still receives an acceptable return.
The output should show the first point of failure. Is it the minimum cash balance, a coverage test, a missed payroll, an inability to fund integration, or an equity requirement? A lender and an equity partner will trust a model more when it identifies the problem plainly.
Quantify integration instead of burying it
Integration risk is usually hidden in optimistic timing. Separate paper synergies from realized synergies by month. Give each initiative an owner, start date, cost, dependency, and realization curve. Payroll harmonization, systems migration, vendor consolidation, and cross-sell should not all begin and finish in the same period.
Recent material on M&A modeling emphasizes restructuring costs, pro forma debt schedules, covenant analysis, and synergy realization timelines. Academic work on M&A due diligence also highlights the need for unified data interfaces when integrating information from multiple sources, as discussed in this research on financial modeling and M&A due diligence.
Model execution slippage across the first 12 to 36 months post-close, rather than treating integration as a single adjustment, as recommended in that research. If payroll integration is delayed, show the duplicate cost. If cross-sell requires clean customer data, show the delay caused by incomplete records. If a bolt-on depends on shared systems, test the acquisition without immediate access to those systems.
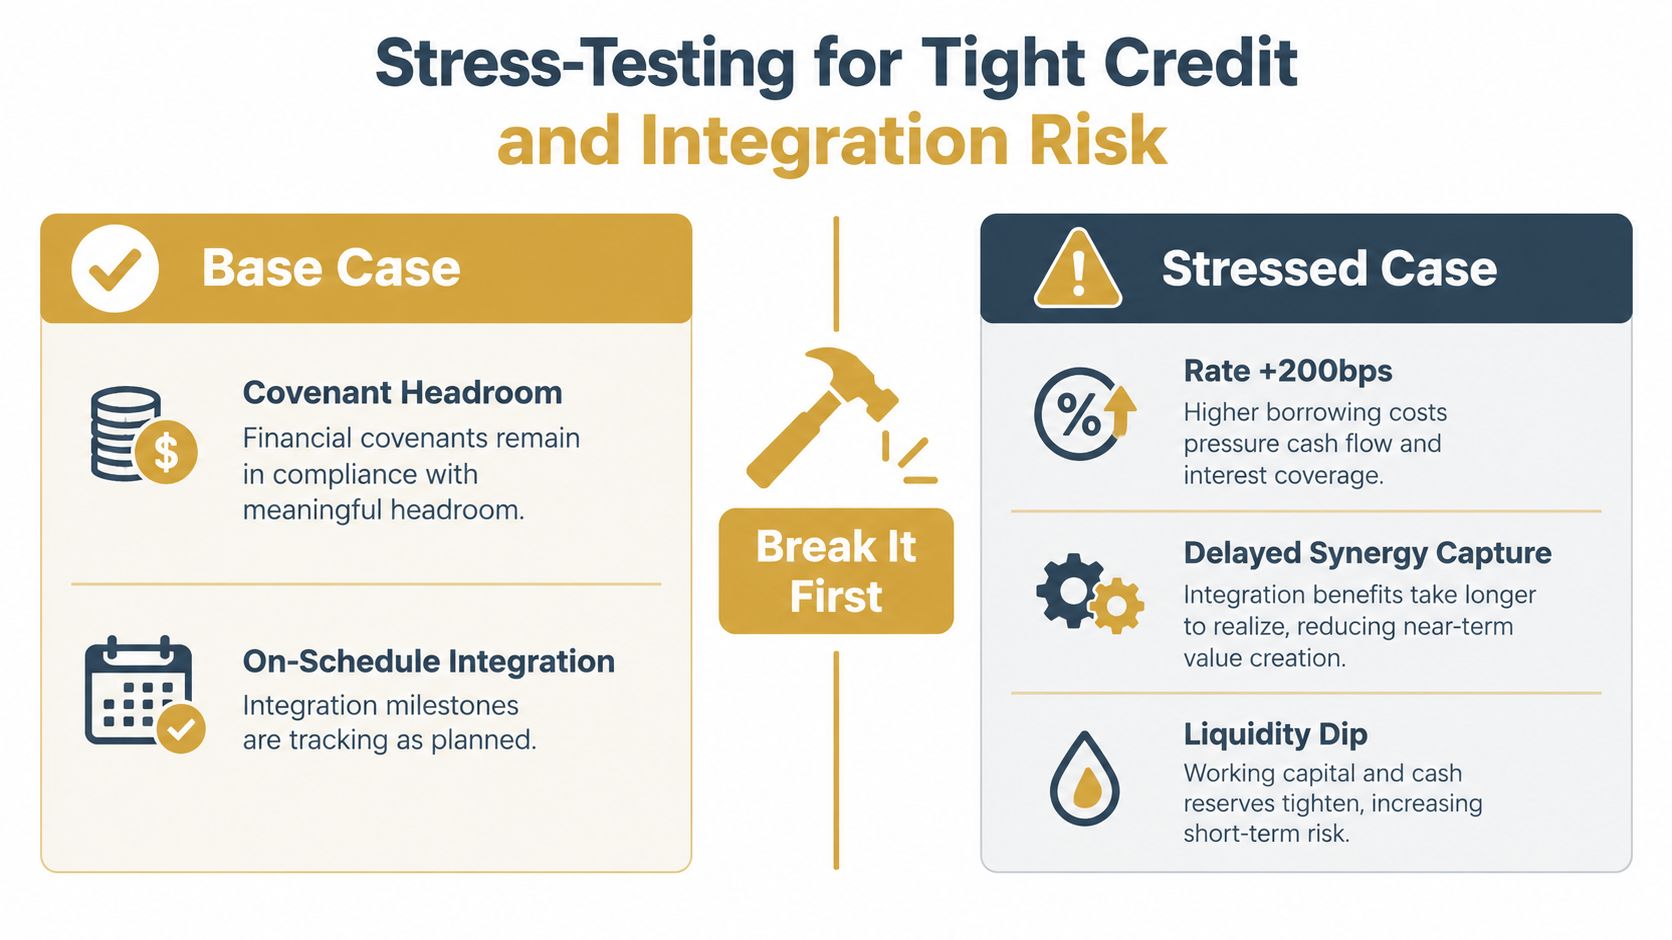
The best stress case isn't theatrical pessimism. It's a set of operational events that a buyer can recognize, assign, monitor, and mitigate.
Investor-Ready Outputs and Template Guidance
A working spreadsheet becomes an investor-ready acquisition financial model when another person can audit it without relying on the builder's memory. Put assumptions in one clearly labeled area, keep calculations traceable, separate historical data from projections, and include checks that flag broken links or unbalanced statements.
The final workbook should contain:
- Assumptions page: Source, owner, rationale, case designation, and date for each material driver.
- Historical and normalization tabs: Reported results beside adjusted results, with every add-back documented.
- Sources-and-uses schedule: Closing cash requirements, financing, fees, working capital, and liquidity reserve.
- Debt schedules: Tranche-level balances, interest, repayment priority, and covenant calculations.
- Scenario outputs: Base, upside, downside, liquidity stress, and integration delay cases.
- Return summary: Equity invested, distributions, debt paydown, exit proceeds, IRR, and MOIC.
- Audit checks: Sources equal uses, balance sheet balances, cash roll-forward reconciles, and debt balances tie to the statements.

A reusable template should provide structure without forcing every target into the same assumptions. Keep the workbook modular so you can replace the revenue drivers, financing terms, integration schedule, and ownership waterfall without rewriting the entire model. Version-control the assumptions and make sure the deal memo references the same file version reviewed by lenders and equity partners.
For buyers building repeatable acquisition capability, financial modeling resources for acquisition entrepreneurs can sit alongside lender templates, accounting guidance, and spreadsheet controls. The tool matters less than the discipline. A clean model makes uncertainty visible, preserves an audit trail, and gives decision-makers a defensible reason to proceed, renegotiate, or walk away.
Dealmaker Wealth Society offers acquisition training, deal-structuring education, templates, checklists, mentorship, and a private peer community for buyers working through sourcing, financing, diligence, and post-close growth. Visit Dealmaker Wealth Society to strengthen your acquisition financial model and get practical support for the next deal you're evaluating.













A Creative Business Buying Fable
