
Leveraged Buyout Analysis: A Practical Underwriting Guide
Leveraged Buyout Analysis: A Practical Underwriting Guide
You're staring at a seller draft that looks close enough to sign, your banker is already asking about financing, and the team wants a fast answer before the opportunity slips. The core of leveraged buyout analysis stops being a finance exercise and becomes a decision filter. The fundamental question isn't whether the spreadsheet balances, it's whether the company can carry the debt, survive a bad year, and still leave you with equity worth owning when the exit window opens.
Table of Contents
- Why the Underwriting Question Matters Before You Sign
- What a Leveraged Buyout Model Is Doing
- Forecasting Cash Flows the Lender Will Underwrite
- Sizing Debt Capacity Without Overloading the Equity
- How IRR and Money Multiple Are Built
- The Sensitivity Analysis Most Models Get Wrong
- Running Base, Upside, and Downside Scenarios
- Your Underwriting Checklist Before You Wire the Deposit
Why the Underwriting Question Matters Before You Sign
The moment an LOI gets accepted, the work changes. The seller's momentum starts working against you, the diligence clock gets louder, and every assumption that felt “good enough” in a teaser now has to survive lender scrutiny, board scrutiny, and your own downside case.
The three questions that decide whether this deal deserves capital
A first-time buyer usually asks, “How much debt can I raise?” That is the wrong first question. The better sequence is straightforward. Can the cash flows service the debt, what do the returns look like if they can, and what happens to the equity if they can't.
Those questions matter because the history of debt-financed acquisitions is full of deals that looked powerful on the way in and fragile on the way out. The modern market expanded sharply in the 1980s, when U.S. acquisition activity rose from $1.4 billion in 1979 to $77 billion in 1988. The same period also helped formalize the analytical framework around target EBITDA, debt service, purchase price multiples, and projected exit multiples, as laid out in the NBER working paper.
That framework still governs how disciplined buyers underwrite today. The question for the sponsor is not only whether debt financing increases upside, but whether it leaves the downside recoverable if operating performance slips, rates reset, or the exit market weakens.
Practical rule: if a deal only works when everything goes right, it has not been underwritten yet.
Before signing, treat every LBO memo as a stress test, not a pitch deck. The model should earn the right to exist by answering the same trade-off in different ways, from the operating forecast to exit timing. If you want a broader acquisition-planning lens, the resource library at Dealmaker Wealth Society's financial modeling guide sits in the right part of the process, between deal screening and live diligence.
What a Leveraged Buyout Model Is Doing
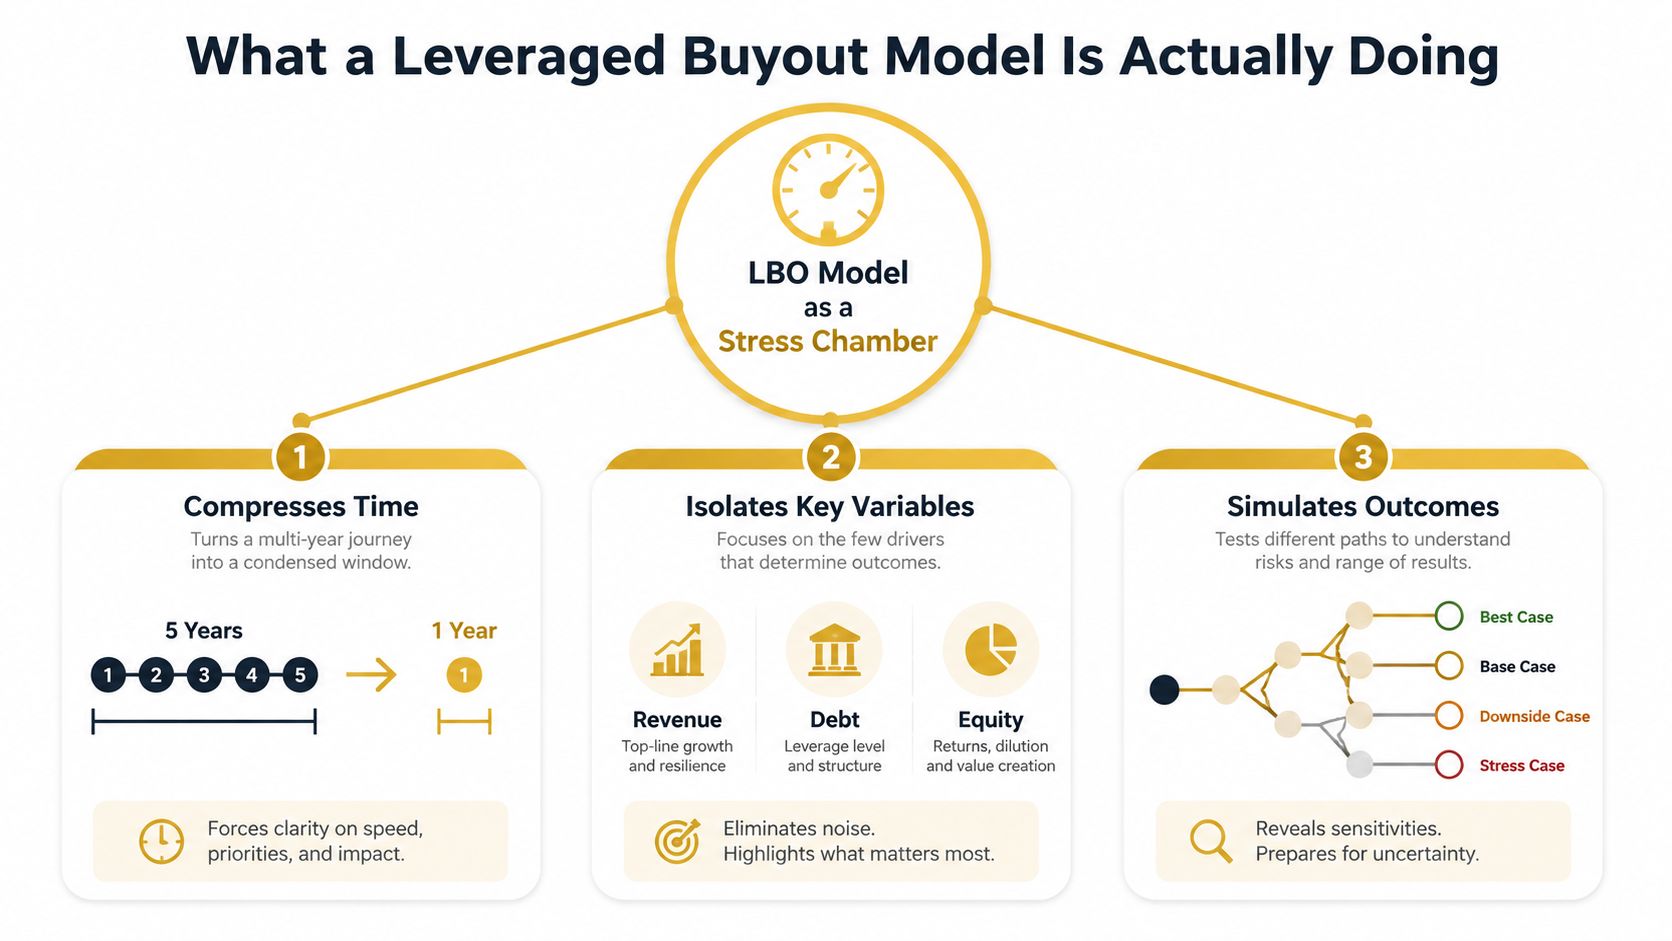
A deal model is a stress chamber for a target company. It compresses a business's next several years into one spreadsheet, then asks a blunt question, whether the equity still survives after debt service, operating volatility, and a possible exit valuation change.
The model grew out of market cycles, not theory alone
The reason the modern model looks the way it does is historical. The 1980s boom created a playbook for how debt-financed acquisitions behave when credit is abundant, and the late-1980s default wave made downside analysis impossible to ignore. In a study of late-1980s buyouts, about 28% filed for Chapter 11 or defaulted on debt payments by early 1993, which is why models became focused on debt capacity and cash-flow durability (SMU study).
That same logic later traveled globally. The literature notes that LBOs became a fast-growing segment of M&A worldwide after 2001, with global transaction values reaching around $400 billion in 2006. The structure is the same whether the buyer is local or cross-border, because the math still turns on debt financing, cash conversion, and exit price.
Four outputs tell you four different things
A serious model usually produces four core outputs:
- Sources and uses, which show what the transaction costs and capital stack look like.
- Debt schedule, which tracks how debt amortizes, sweeps, or refinances over time.
- Returns summary, which converts the operating story into IRR and money multiple.
- Sensitivity grid, which tests how fragile the return is if assumptions move.
Those outputs answer different underwriting questions. Sources and uses tell you whether the capital stack is realistic. The debt schedule tells you whether cash can absorb the obligations. The returns summary tells you whether the equity outcome is worth the effort. The sensitivity grid tells you how far the model can bend before it breaks.
For a practical workflow around acquisition analysis and modeling, the checklist in this financial forecasting framework for potential acquisitions fits naturally beside the model outputs. It is a way to bound the range of futures the equity can survive, not a prediction exercise.
A lender-facing view of coverage still matters here, which is why the DSCR tips from Business Lending Blueprint are useful as a complement to an acquisition model. They force the same question from a different angle, whether ongoing cash flow can support debt without leaving no room for error.
Forecasting Cash Flows the Lender Will Underwrite
Forecasting is where optimism gets priced into reality. Lenders do not care about a polished narrative unless it converts into free cash flow available for debt service, because that is what repays principal, covers interest, and protects the covenant package.
Build from operating drivers, not from the debt you want
Start with the business itself. Revenue growth, gross margin, and operating expense assumptions flow into EBITDA, then EBITDA gets adjusted into the cash available for debt service after working capital changes, capex, and one-time items. Add-backs can be legitimate, but they are also negotiable, because every adjustment has to survive lender skepticism.
A practical small-business example makes this concrete. Suppose the target generates steady EBITDA, but part of that number includes one-time legal expense, a temporary staffing spike, and a maintenance capex requirement that is easy to understate. A buyer may treat the one-time item as an add-back, but the lender will ask whether the expense disappears after closing. The same tension applies to working capital, because a growing business may need cash tied up before it ever shows up as debt service capacity.
A useful cross-check is the forecast worksheet in this financial forecasting framework for potential acquisitions, because it forces the model back to operating drivers instead of the financing structure. For coverage discipline, the DSCR tips from Business Lending Blueprint help translate operating cash into the lender's debt service test.
Underwriter's check: if the business needs the forecast to be perfect, the model is already too tight.
The hold period should match the cash flow reality
The hold period is not arbitrary. The point of the forecast is to give debt time to amortize before the exit. If the assumptions do not produce debt reduction over that window, the deal may still close, but it probably should not.
That is why technical LBO work usually uses a 5- to 7-year forecast horizon. The period needs to be long enough for operating cash flow to pay down debt, absorb some volatility, and still leave an exit that does not depend on flawless execution. A shorter horizon can hide debt pressure that only shows up after a rate reset, a working-capital build, or a weaker resale market.
Hold-period discipline also changes how you read the downside. If debt service only works when growth is strong and margins never slip, the model is not really underwritten. It is a bet on perfect conditions.
Sizing Debt Capacity Without Overloading the Equity
A deal can look fine on paper and still fail once the business hits a softer quarter. Debt capacity should reflect what the company can tolerate in a bad year, rather than what a banker can place in a good one. That distinction matters because debt only improves returns until distress risk starts to outweigh the tax benefit and the lower equity check at closing.
Coverage ratios should lead the structure
The cleanest underwriting sequence starts with cash flow coverage. Interest coverage and fixed-charge coverage show whether the business can pay for the debt stack after operating volatility, capex, and working capital effects. Once those ratios hold up, the capital structure can be layered into senior debt, mezzanine, seller paper, and equity.
That layering is not cosmetic. Each tranche carries a different price, covenant package, and risk profile, so the stack should reflect cash flow quality and the amount of stress the business can absorb. A recurring business with steadier cash generation can usually support more senior debt, while a cyclical target often needs a thinner stack and a larger equity cushion.
For a wider look at how acquirers balance capital sources, practical capital raising options can help frame the trade-off between debt and equity financing before a term sheet gets too far along. On the acquisition side, the financing discussion at comparing equity and debt financing for acquisitions is a useful companion to the model.
The debt trade-off is real, and it is not symmetric
Academic and practitioner sources agree that debt adds value through tax shields and lower initial equity outlay, but only up to the point where expected bankruptcy costs and weaker coverage ratios start to outweigh the benefit (NYU valuation note). That is why debt should be tested as a range, not treated as a single answer.
A simple debt walk usually shows the same pattern. As debt rises, the base-case equity return often improves because less equity is written at closing. The downside cone widens at the same time, because a small miss in EBITDA or a small increase in interest cost can erase the cushion quickly.
Debt capacity is not what the deal can carry in the spreadsheet you want. It is what the business can carry when the forecast gets worse and the lender gets less patient.
That is the decision point. If the capital stack only works because the good case is doing all the heavy lifting, the structure is too aggressive. A buyer who wants a steadier outcome usually has to accept a less dramatic equity story up front, because the first job of the model is survival, not optimization.
How IRR and Money Multiple Are Built
IRR and money multiple are return summaries, but they get misread when people treat them like targets instead of outputs. They are diagnostics. They show whether the deal mechanics produce a coherent equity story.
The return engine has three moving parts
In LBO math, returns come from entry multiple, exit multiple, and the pace of debt paydown. EBITDA growth helps too, but once borrowed capital enters the structure, those three mechanics do most of the work. A lower entry multiple can leave more room for upside, while a stronger debt-paydown path can matter just as much.
The classic comparison is two deals bought at the same EBITDA multiple with different capital structures. The purchase price is identical, but the equity check is not. The more levered deal can show a stronger IRR in the base case because less equity was invested up front, even if total operating profit is similar.
IRR also rewards speed. If capital comes back earlier through deleveraging or interim distributions, IRR can improve even when the absolute profit barely changes. That is why IRR and money multiple need to be read together, not in isolation.
The formulas matter less than the sequencing
The modeling sequence in an LBO is straightforward. Project EBITDA, subtract remaining debt at exit, and calculate equity value. Then compare that equity value to the original equity invested to derive money multiple, and use the timing of the exit cash flow to calculate IRR.
The standard framework uses a 5- to 7-year forecast, because that is the period where debt reduction and exit value are meant to interact in a meaningful way.
For a quick visual explanation of the mechanics, the embedded walkthrough below is helpful.
The right takeaway is blunt. A deal does not become good because the IRR is high. It becomes credible when the inputs, debt stack, and exit timing all point to the same result without hidden fragility.
The Sensitivity Analysis Most Models Get Wrong
Most LBO models still flex the wrong variables first. They show a neat grid for EBITDA growth and exit multiple, then leave out the pressures that can break a deal when credit tightens.
Rate resets and refinancing risk belong in the grid
A better sensitivity table asks what happens if debt costs rise, cash conversion slows, or refinancing happens in a weaker market. That matters because empirical research shows buyout debt levels are driven by factors different from public-company debt levels, so standard debt-level heuristics can mislead when debt markets reprice quickly (LSE research).
The point is practical. A deal can look strong on paper if EBITDA grows and the exit multiple holds, yet still be fragile if floating-rate exposure lifts interest expense or if covenant headroom is thin. That kind of structure is paper-attractive, structurally vulnerable.
Build a downside lens that can kill the deal
A serious sensitivity pass should include at least three stress questions:
- Interest rate stress: what happens if rate resets reduce free cash flow enough to slow amortization?
- Covenant headroom: how close does the business get to the threshold if EBITDA slips?
- Refinancing runway: is there enough time before maturity to survive a weaker credit market?
If the answer to any of those is uncomfortable, the deal deserves a lower price or a different capital stack. A model that only tests upside confirmation supports sales, not underwriting.
You can see the problem in deals that still “work” mathematically but no longer feel financeable. The equity return may still be positive, yet the debt path is too tight, the maturity wall arrives too early, and a small operating miss leaves no recovery route. A buyer should walk away from that kind of deal, even if the base-case IRR looks attractive.
Running Base, Upside, and Downside Scenarios
A three-scenario view is where the model stops pretending the future is smooth. Base, upside, and downside should all start from the same purchase price, then separate on operating performance, exit assumptions, and whether the debt load can still be carried.
A good sponsor will test the same capital structure against three different operating paths. The point is not to make the downside look dramatic for its own sake. It is to see whether a deal still clears the hurdles when growth is softer, cash conversion slows, and refinancing gets less friendly.
A representative scenario table
| Scenario | EBITDA Growth (CAGR) | Exit Multiple | Equity IRR | MoM | Interest Coverage (Yr 2) |
|---|---|---|---|---|---|
| Base | Qualitatively steady | Entry-like | Moderate | Solid | Comfortable |
| Upside | Stronger operating improvement | Better market exit | Higher | Better | Wider |
| Downside | Slower conversion and softer demand | Compressed | Weak or negative | Thin | Tight |
The table is not trying to fake precision. It is there to show how quickly the equity case changes once the operating path and exit market move in opposite directions. A deal can still look attractive in the base case and upside case, yet fall apart when the downside starts to squeeze cash flow and interest coverage at the same time.
Exit timing should follow ownership reality, not wishful thinking
Hold-period data also keeps exit timing honest. In the historical sample, 63% of debt-financed acquisitions were still privately owned by August 1990, 14% had returned to public status, and 23% had moved to other public owners, with a median of 6.70 years remaining private (SMU study). That points to a simple conclusion. A model that depends on a fast sale into a strong market is making an assumption the market may not reward.
That matters because the exit line in an LBO model is often where the story gets easiest to overstate. When the business is improving, it is tempting to assume the buyer gets a clean exit at a higher multiple. When the credit market is weaker, though, the sponsor may have to hold longer, refinance on worse terms, or accept a lower valuation. A scenario set that ignores those outcomes is giving the equity case too much credit.
The right use of scenario analysis is to test whether the downside changes the buy decision. If the answer is no, the model is probably too forgiving. If the answer is yes, the deal has at least been priced against a real operating and financing path, not a clean spreadsheet outcome.
Your Underwriting Checklist Before You Wire the Deposit
The last check before a deposit should force the model into uncomfortable questions. Debt can make a good deal work harder, but it also makes a weak deal break faster when cash flow slips or credit terms reset.
The checklist that should govern the final go or no-go
- Cash Flow Adequacy: can EBITDA and free cash flow support debt reduction for several years, even if working capital tightens and operating margins do not behave as planned?
- Debt Capacity: have you sized debt from coverage in a bad year, not from what the market will place in a good one?
- Rate Sensitivity: have you stressed the model for higher floating-rate expense, refinancing pressure, and slower cash conversion, not just growth?
- Covenant Headroom: do you know how close the business gets to breach if EBITDA slips and amortization keeps running?
- Exit Reality: is the exit multiple tied to a market case you can defend, not to a hope that the buyer pool will pay more later?
- Downside Discipline: would the bear case change your willingness to buy at the current price, or does the model only work in the clean path?
Those questions matter because the structure does not forgive loose underwriting. The acquisition boom of the 1980s showed how fast debt-financed deals can scale when credit is easy and the market is willing to fund them, and the default record showed how quickly the same capital structure can fail when those conditions turn (NBER working paper). That is why a buyer should test ranges, not anchor on one point estimate.
A final pass should ask whether the downside changes the decision, not just the projected return. If the answer is no, the model is probably too generous. If the answer is yes, the deal has at least been priced against a real operating and financing path, not a clean spreadsheet outcome. For acquisition analysis, financing structure, and post-close execution, Dealmaker Wealth Society is built around those decisions, and it is worth reviewing before you wire a deposit on a deal that still needs stress-testing.

From the Dealmaker Blog















A Creative Business Buying Fable
