
Leveraged Buyout Model Excel: Build, Test, and Close Deals
Leveraged Buyout Model Excel: Build, Test, and Close Deals

You're staring at a blank workbook, the buyer is asking for a quick view on returns, and the seller wants an answer before the weekend. That's exactly where a leveraged buyout model Excel build earns its keep, because it has to turn a messy acquisition into a clean yes or no on sponsor economics. The model isn't there to look advanced. It's there to prove whether debt, cash flow, and exit value can work together without breaking the deal.
A good LBO model starts with a narrow question, not a fancy spreadsheet. Can the business support the debt load, how much equity is needed, and what does the sponsor earn when it exits? The answer usually comes down to IRR and MoIC, with a holding period often assumed at 3–7 years and financing stress tested through Debt/EBITDA, which in LBOs is often cited around 4.0x to 7.0x depending on industry and market conditions (CFI on LBO model fundamentals). If those outputs don't hold up, everything else is decoration.
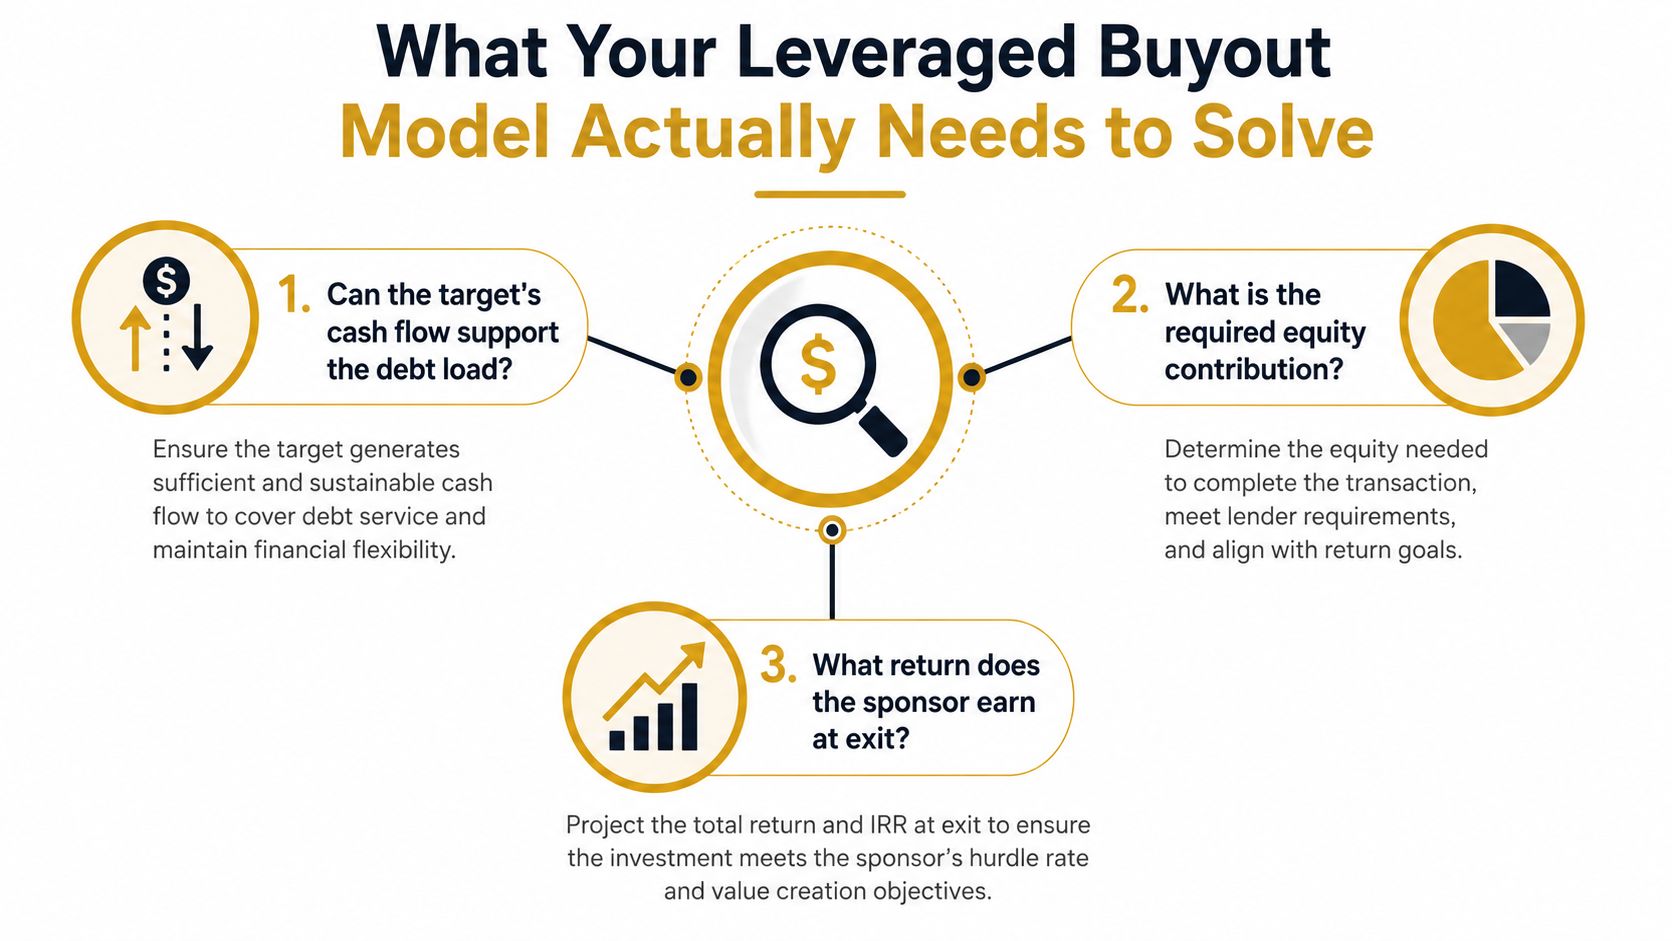
Table of Contents
- What Your Leveraged Buyout Model Actually Needs to Solve
- Setting Up the Transaction Structure and Sources and Uses
- Building the Operating Forecast and Debt Schedule
- Calculating Sponsor Returns at Exit
- Stress Testing Returns with Floating Rate Sensitivity
- Troubleshooting Common Modeling Errors
- From Excel Model to Deal Execution
What Your Leveraged Buyout Model Actually Needs to Solve
A first-time buyer usually opens Excel and tries to model everything at once. That's backwards. The model only needs to solve three problems well, and every row should serve one of them, cash flow support, equity contribution, and exit return.
Start with the sponsor's decision, not the accounting layout
The sponsor is not buying a spreadsheet, it's buying a cash-generating company with debt layered on top. Historically, LBO modeling became a standard underwriting tool because it translates acquisition financing into measurable return math, including cash-on-cash multiple, IRR, and debt service coverage ratios (BIWS simple LBO model). That means every input has to help answer whether the buyer gets paid enough for the risk.
The cleanest way to think about it is this. Operating forecasts tell you how much cash the business can produce. The debt schedule tells you how much of that cash gets consumed by interest and amortization. Exit valuation tells you what's left for equity at the end. If those three pieces aren't connected, the model may balance mechanically and still give a useless answer.
Practical rule: If an input doesn't change debt capacity, exit equity, or sponsor return, it probably doesn't belong in the main model view.
Holding period matters because time changes the math. In practical modeling workflows, the holding period is often assumed to be 3–7 years (CFI). A shorter hold can help if exit value is strong early, but it also leaves less time for debt paydown. A longer hold gives cash more time to de-risk the capital structure, but it also exposes the deal to more operating and rate volatility.
A useful mental check is to ask whether the model can explain the deal in one sentence. If not, the structure is still too loose. The model should make it obvious whether the company can carry the debt, what equity the sponsor must put in, and what return the sponsor gets if the exit happens on schedule.
Setting Up the Transaction Structure and Sources and Uses
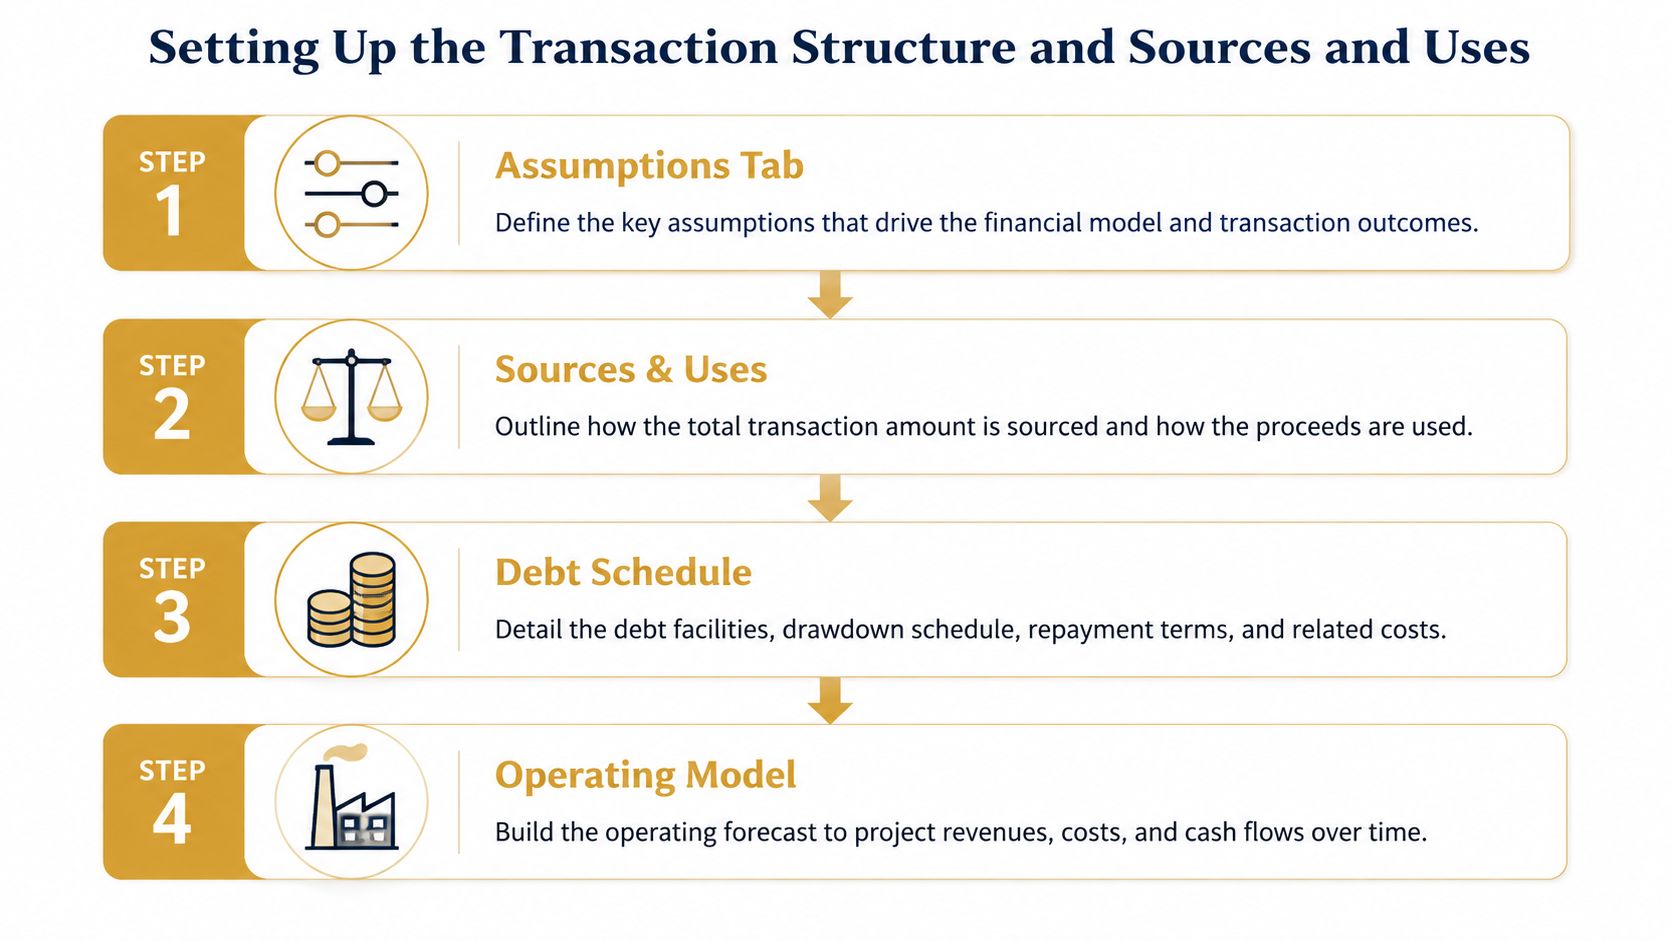
A disciplined leveraged buyout model Excel file has a sequence. Assumptions first, then sources and uses, then operating statements, then the debt schedule, then returns, then sensitivity analysis. That order matters because it keeps the file from creating circular logic before the core transaction is even defined.
Build the tabs in the order the deal actually works
The assumptions tab should hold the transaction terms, not the operating story. That includes entry and exit multiples, debt pricing, amortization assumptions, and fee assumptions. One practitioner workflow recommends this exact tab order so the model flows from transaction inputs to IRR and MoIC outputs without circular logic errors (CT Acquisitions).
The sources and uses table comes next because it tells you how the purchase gets funded. In middle-market work, transaction fees of 2-3% of enterprise value, financing fees of about 2.5% of debt raised, and a minimum cash balance at close of $5-20 million are common benchmark ranges used to make the table balance and avoid overstating distributable cash at close (CT Acquisitions). Those are practical modeling guardrails, not decorative inputs. If you skip them, the model can look underwritten when it really isn't.
The operating statements belong after the deal structure because they need the transaction context to be meaningful. A buyer who models revenue and EBITDA first, then retrofits the capital structure, usually ends up rewriting the workbook twice. The financing terms determine what cash is left after interest, and that's what eventually drives equity value.
For a broader view of acquisition funding choices, this guide to understanding acquisition financing options fits naturally next to the sources-and-uses work. It helps when you're comparing debt-heavy structures against more conservative capital mixes.
The sources and uses page should be boring. If it feels clever, it's probably hiding a mistake.
Building the Operating Forecast and Debt Schedule
The model starts behaving like a real deal instead of a pitch deck. Revenue, EBITDA, working capital, capex, and taxes all feed the cash that pays down debt, and the debt schedule feeds the interest expense that reduces that cash. The loop is why this section is usually where first-time builders slow down.
Connect operations to financing without breaking the file
A simple operating forecast doesn't need theatrical complexity. It needs a believable path from sales to EBITDA to free cash flow, with working capital and capital expenditures flowing through in a way that the debt model can use. In a sample build, the business can be projected from a revenue base with a stable EBITDA margin, but the exact assumption set matters less than the consistency of the logic across years (MentorMe Careers).
The debt schedule is the technical heart of the file. Interest should link to beginning or average debt balances, which creates circularity and often requires a circularity toggle or iterative calculation control in Excel (CT Acquisitions). That's not a nuisance, it's the price of realism. If debt service depends on cash flow and cash flow depends on interest, the model has to manage the loop instead of pretending it doesn't exist.
A good separation of sections helps here. Keep assumptions in one place, operating forecasts in another, and debt mechanics in their own tab. That separation makes the workbook easier to audit and easier to explain to lenders or capital partners.
A useful analogy from a different kind of scheduling problem is an operations team equipment solution, where the value comes from cleanly linking demand, availability, and timing. LBO modeling works the same way. If one link is off, the whole forecast can drift.
Diagnostic habit: Check whether interest, amortization, and opening debt balance all tie before you trust any return output.
The debt schedule should show opening balance, scheduled principal reduction, optional prepayments if the deal allows them, and closing balance. If that closing balance doesn't reconcile into the next year's opening balance, stop. The return math is downstream of that error, so the model can look polished while the sponsor return is wrong.
Calculating Sponsor Returns at Exit
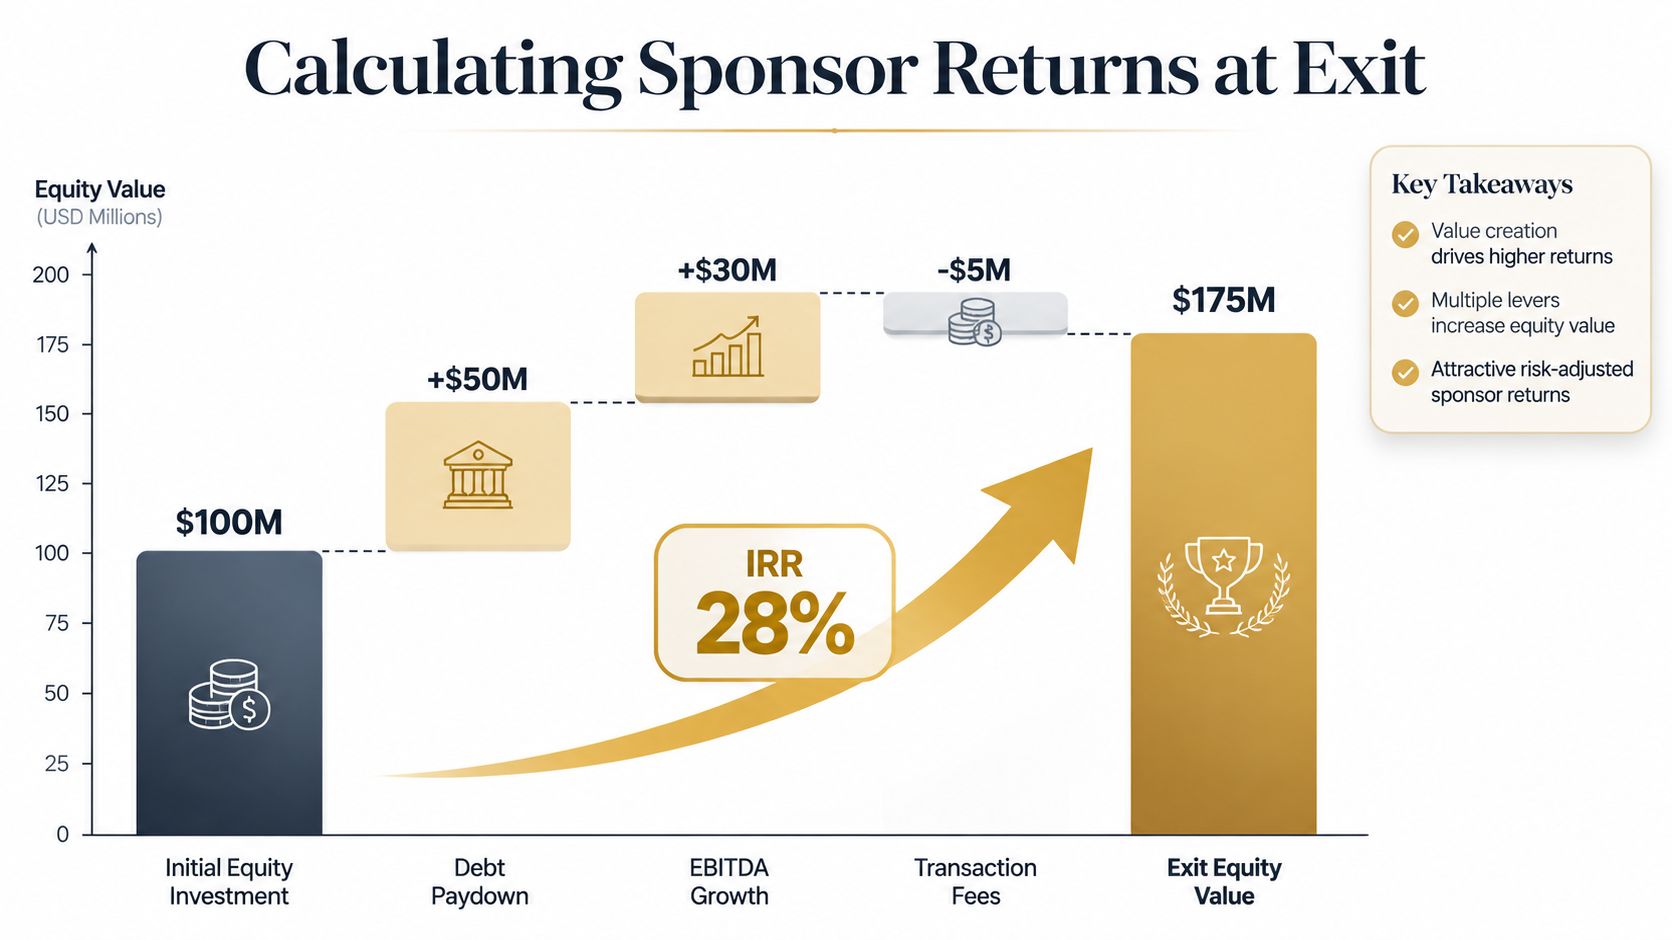
Every sponsor wants the same thing at the end of the file, the equity check after debt is paid down. That's why the exit section matters more than any fancy formatting in the rest of the workbook. Once the model gets here, the question is simple, how much is the business worth, how much debt remains, and what does that leave for equity?
Turn enterprise value into equity value
The exit formula is straightforward. Apply an exit multiple to projected EBITDA, subtract remaining debt, and you get equity value. That equity value is then compared against the initial equity investment to calculate MoIC, while the timing of the cash flows gives you IRR (HBS Online). A clean file makes that chain obvious rather than hiding it in nested formulas.
A simple worked example shows how sponsor returns scale mechanically. In one example, a model targeting a 3.0x MoIC implied an initial equity investment of $400 million (BIWS). That kind of relationship matters because it shows the sensitivity of the whole deal to entry price and borrowing assumptions. If the sponsor pays more at close, the return hurdle gets harder to clear, even if operations improve.
The exit section is also where the model becomes brutally honest about financial risk. Debt can amplify equity returns, but it can also magnify the damage if earnings soften or interest costs rise. That's why exit valuation should be tied back to the operating forecast, not dropped in as a standalone guess.
For buyers thinking about how the exit itself may unfold, the discussion of understanding exit strategies post acquisition is worth keeping close. The model only gets you to the exit door. The transaction still depends on how and when that exit happens.
Keep the return math grounded
A reliable Excel model should calculate sponsor returns from actual cash flow timing, not from a shortcut multiple alone. If the debt schedule, taxes, and capital spending are wrong, the IRR can look attractive while the equity story is fragile. The whole point of the model is to catch that before the offer goes out.
For a broader set of modeling traps that often show up in transaction work, it also helps to avoid common modeling pitfalls. The exact asset class can differ, but the discipline around reconciliation and logic is the same.
Stress Testing Returns with Floating Rate Sensitivity
Most LBO templates stop at entry multiple versus exit multiple. That was enough when rates were low and debt was cheap. It's not enough now, because floating-rate debt can change the return profile even when the purchase price and exit valuation stay unchanged.
Test SOFR, not just valuation multiples
Modern buyers need to ask how SOFR moves affect interest expense, free cash flow, and covenant headroom. Existing LBO Excel guides explain how to build a debt schedule, but they often don't answer the practical question buyers now ask most often, how much does a 100 bps rate move change equity returns, free cash flow, and the probability of breaching cash sweep or covenant requirements (Wall Street Prep). That question matters because borrowing costs stayed materially higher after the rate shock of the last two years, while private credit remained a major source of acquisition finance.
A model that only tests entry and exit multiple can miss a deal that looks fine on paper but becomes tight under rate pressure. Two deals with the same entry multiple can produce very different outcomes depending on rate floor, amortization profile, and timing of principal paydown. That's why the sensitivity work should include rate scenarios alongside the usual purchase price sensitivities.
| Sensitivity Analysis Dimensions for Modern LBO Models | ||
|---|---|---|
| Traditional Sensitivities | Modern Additions | Why It Matters |
| Entry multiple | SOFR levels | Interest expense changes sponsor returns |
| Exit multiple | Margin compression | Profitability affects debt service capacity |
| Revenue growth | Exit timing | More time can help or hurt, depending on rates |
The table above is the shift buyers need to make. The old lens tells you what happens if the market pays more or less at exit. The new lens tells you whether the financing itself stays workable if rates move before the sale.
If the model can't show covenant room under a higher-rate case, it's not a deal model yet, it's only a valuation sketch.
The practical build is simple, but the discipline isn't. Create scenario tables for SOFR, margin, and exit timing. Then compare those cases against the debt paydown path and the return hurdles. That gives you a more honest view of whether the equity check can survive real financing conditions.
Troubleshooting Common Modeling Errors
A bad leveraged buyout model Excel file rarely fails loudly. It usually fails in small ways, a balance sheet that is slightly off, debt balances that don't roll correctly, or a cash plug that masks a broken assumption. Those errors can make the IRR look acceptable when the economics are unstable.
Check the reconciliation before you trust the return
The most common technical pitfall is failing to reconcile the balance sheet and cash flow statement after debt amortization, working capital changes, and capital expenditures are introduced (Business Valuation). If the cash plug doesn't reconcile each year, the model's bottom line can drift without being obvious on the face of the file. That's why seasoned modelers check the balance sheet first and the return output second.
Start by testing the debt balances year by year. The opening balance should equal the prior period's closing balance, and any scheduled principal reduction should show up in the right line item. If that bridge breaks, the interest expense is probably wrong too, which means the equity value at exit is also wrong.
Next, verify that the cash line behaves like cash. A model can still present a pretty output page while the underlying working capital and capex logic are inconsistent. If you see a positive cash balance where the operating cash flow can't support it, the model is probably using a plug too aggressively.
Use a short audit routine
- Balance Sheet Doesn't Balance: Rebuild the affected year from the debt schedule forward and check each bridge line.
- Circular Reference Error: Separate assumptions from calculations, then use iterative calculation only where interest depends on debt.
- Wrong Debt Paydown Logic: Confirm that amortization and optional prepayments are flowing through the correct tranche.
- Inconsistent Exit Timing: Make sure the exit year is locked across the operating model and return summary.
For a first pass, don't debug by rewriting formulas randomly. Trace the error backward from the return summary to the debt schedule, then from the debt schedule to the operating forecast. That order saves time and shows you where the logic broke.
The cheapest mistake in LBO modeling is caught before the offer. The expensive mistake is discovered after a capital partner asks why the debt balance doesn't reconcile.
From Excel Model to Deal Execution
A good model is only useful if it changes what you do in the deal. Once the return math is stable, the workbook becomes a decision tool for pricing, negotiating, and screening away bad deals before they cost you real time. That's the point where the spreadsheet starts serving the transaction instead of the other way around.
Turn outputs into a bidding range
The cleanest way to use the model is to translate IRR and MoIC targets into a maximum purchase price. If the assumed debt structure can't support the sponsor's hurdle, the offer needs to move down or the structure needs to change. The model also helps identify deal breakers early, especially when a rate-sensitive capital structure can't tolerate higher interest expense without squeezing equity returns.
That's where the workbook becomes useful in capital conversations. It gives you a reasoned ceiling on price, a view of how much debt the business can carry, and a clear read on what happens if the deal closes later than expected. It also tells you where to push back with the seller, whether that's on valuation, timing, or financing terms.
Deal discipline: The fastest way to lose credibility is to quote a price before your model has tested the downside cases.
A practical acquisition process doesn't stop at the model. The same discipline should feed deal sourcing, financial due diligence, and post-close planning. That's where tools, training, and deal support can help a buyer stay organized, and Dealmaker Wealth Society is one option that publishes acquisition education, checklists, and live coaching for buyers working through those steps.
The final habit is simple. Use the Excel model to screen, price, negotiate, and prepare, then keep refining it as due diligence changes the numbers. Buyers who do that tend to negotiate from a position of logic instead of hope.
If you're building your first acquisition model, Dealmaker Wealth Society offers acquisition training, deal structure guidance, and practical checklists that fit this exact workflow. Visit Dealmaker Wealth Society to work through the financing, underwriting, and post-close planning steps with a framework you can use on a live deal.

From the Dealmaker Blog














A Creative Business Buying Fable
