
How to Calculate the Leverage Ratio with Real-World Examples
How to Calculate the Leverage Ratio with Real-World Examples

You've got the seller's teaser, the banker's questions are already getting sharper, and the LOI draft is sitting in your inbox before you're fully comfortable with the numbers. That's the moment the financial ratio stops being an accounting term and starts deciding whether the deal gets financed, whether the business can carry the debt, and whether you're walking into a structure that can survive a rough quarter.
Getting how to calculate the leverage ratio right isn't about plugging one figure into a calculator and calling it a day. In real acquisitions, the ratio changes once you normalize debt, clean up EBITDA, net cash properly, and decide what counts as true borrowings versus temporary operating liabilities. If you skip that work, you can make a deal look safer than it is, or worse, reject a good deal because the raw statements were messy.
Table of Contents
- Why the Leverage Ratio Matters Before You Sign Anything
- The Four Corporate Debt and Capital Structure Formulas You Will Use Most
- How Banks Calculate the Leverage Ratio Differently
- Normalizing Debt and EBITDA Before You Divide
- Sector Benchmarks That Actually Matter for Buyers
- Worked Example on a $2M EBITDA Acquisition
- Your Pre-LOI Leverage Checklist
Why the Leverage Ratio Matters Before You Sign Anything
The financial question usually shows up right when the pressure's highest. You've got a seller pushing for speed, a lender asking for financials, and an offer decision that depends on whether the business can support the structure you're proposing. That's why the ratio matters before you sign anything, not after closing when the covenants are already in motion.
At the simplest level, debt-to-capital ratios convert debt into a size-adjusted measure that lenders and buyers can compare across businesses. A company with $2 million of assets and $1 million of equity has a debt-to-capital ratio of 2.0, which means assets are twice equity, and that kind of framing is exactly why banks, investors, and acquirers use this metric to judge financing risk (Investopedia on leverage ratio formulas). Higher levels of this metric usually signal more borrowed capital funding the business, which is why it often tightens the room you have for error.
What the ratio decides in a live deal
The ratio influences four decisions fast. Debt sizing tells you how much borrowed capital the lender is likely to tolerate. Pricing shifts because more borrowed capital usually means more perceived risk. Structure changes when you have to decide between senior debt, seller note, earn-out, or more equity. And walk-away discipline gets real when the pro forma ratio looks fine only because the EBITDA was padded or the debt balance was understated.
Practical rule: If the ratio only works with optimistic assumptions, it doesn't really work.
That's the point of this whole calculation exercise. You're not chasing a neat number for a pitch deck. You're testing whether the business can absorb debt in the actual world, where payroll still hits, revenue still dips, and lenders still test the downside.
The same logic applies when you're reviewing acquisition metrics more broadly, especially if you're comparing debt levels against other deal-quality indicators like cash conversion and working capital behavior. A useful companion resource is metrics assessing business deals, because debt levels never tell the whole story by itself.
The Four Corporate Debt and Capital Structure Formulas You Will Use Most
A buyer underwrites these formulas differently depending on what is in front of them. Equity sponsors usually look first at debt to equity. Lenders pay closer attention to coverage and repayment capacity. In a small business acquisition, I want all four views before I trust the capital structure, because the clean-looking ratio on the teaser is often built on earnings that still need normalization.
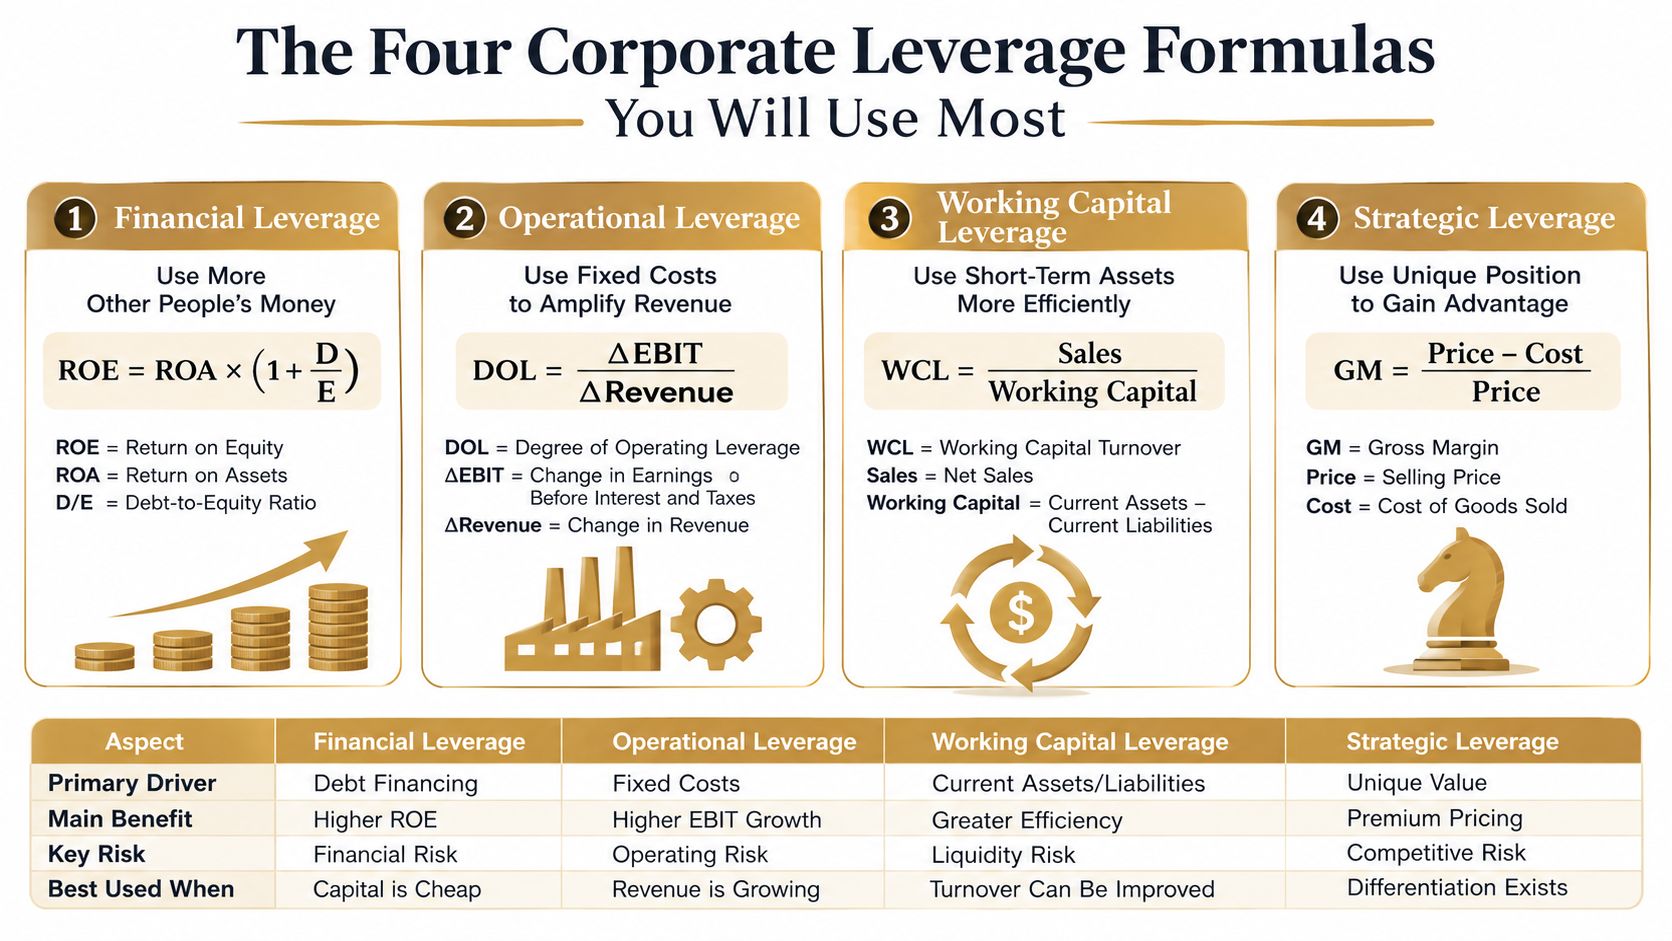
Debt to equity
Debt to equity is Total Debt ÷ Total Equity. It answers a direct question, how much borrowed capital supports each dollar of owner capital? If a target has $10 million of debt and $5 million of equity, the ratio is 2.0. That means debt is twice equity, which is a clear signal for any buyer or lender reviewing the capital structure (Investopedia on debt ratio formulas).
This is the version many equity investors scan first because it is easy to compare across businesses. It also matters in acquisition work because equity can look stronger than it really is if retained earnings were inflated by one-time items, or if the balance sheet still carries stale asset values from an earlier period. A ratio that seems conservative on paper can still leave too little cushion if post-close earnings normalize down.
Debt to assets
Debt to assets is Total Debt ÷ Total Assets. If the same company has $10 million of debt and $25 million of assets, the ratio is 0.4. That means 40% of the asset base is financed with debt, which gives you a different lens than debt to equity because it ties financial obligation to the asset foundation instead of the owner base (FE Training on debt ratio analysis).
Banks and asset-heavy buyers like this view because it helps them think about collateral and solvency. It is especially useful when tangible assets matter a lot to the lending decision. It can also mislead if the asset side is carrying inventory built for a strong season, or if receivables are aging worse than the balance sheet suggests. In those cases, the denominator needs a harder look before you treat the ratio as durable.
Debt to capital
Debt to capital is Debt ÷ (Debt + Equity). With $10 million of debt and $5 million of equity, the ratio is 10 ÷ 15, or 0.67. That number tells you what share of the total capital stack comes from debt rather than owner capital.
This version is useful when you want a cleaner picture of the financing mix. It is often easier to compare across deals than debt to equity when equity can swing wildly because of purchase accounting or retained earnings. In diligence, I use it to see whether the buyer is putting meaningful capital at risk or just recycling a thin sliver of equity into a heavily debt-funded structure.
Debt to EBITDA
Debt to EBITDA is Total Debt ÷ EBITDA. Using the same $10 million debt and $15 million EBITDA, the ratio is 0.67. In practice, buyers and lenders usually use this as the main earnings-based ratio lens because it connects debt to recurring operating capacity (banks reviewing business loan applications).
That only works if EBITDA is real. I have seen deals where seasonality made a strong quarter stand in for a full year, or where add-backs pushed EBITDA high enough to justify debt that the business could not carry. Earn-outs and seller-related adjustments can distort the picture too. A company with $10 million of debt and $15 million of EBITDA can look fine until you strip out one-time revenue, normalize payroll, and net excess cash against debt. Then the same ratio may tell a much less comfortable story.
Practical rule: If you are buying a business, debt to EBITDA is usually the first ratio to stress test, but it should never be the only one.
For a cleaner comparison of financing choices across deal types, see a side-by-side look at acquisition financing structures.
How Banks Calculate the Leverage Ratio Differently
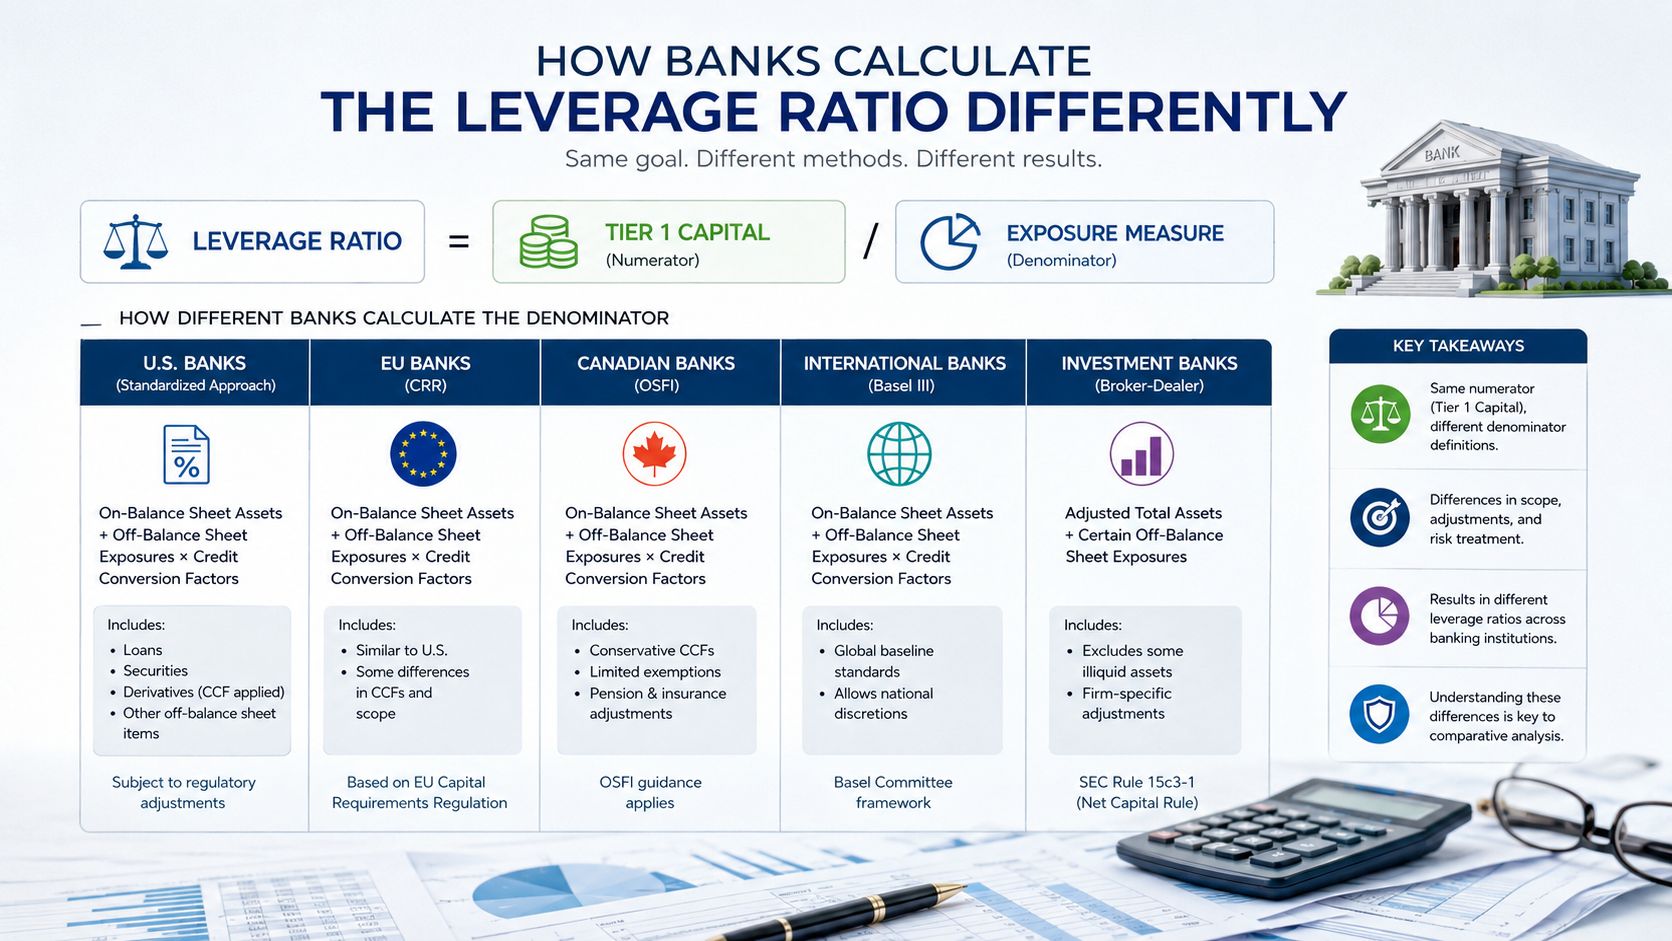
A buyer's debt to EBITDA ratio and a bank's regulatory capital test solve different problems. For an acquirer, the question is whether the business can carry acquisition debt from operating earnings. For a bank, the question is whether it holds enough Tier 1 capital against a broader exposure base, as set out in the HKMA implementation guidance27_CIs_202203.pdf). Mixing those models creates a bad spreadsheet before the diligence work even starts.
The Basel style formula
For banks, the capital ratio is Tier 1 capital divided by the exposure measure. That exposure measure is broader than on-balance-sheet assets because it also captures off-balance-sheet items and derivative exposures. In Hong Kong's guidance, the exposure measure includes items such as replacement cost and potential future exposure, which is a reminder that derivative positions do not disappear just because accounting netting makes them look smaller.
That distinction matters because the ratio is intentionally non-risk-sensitive. A common mistake is to substitute risk-weighted assets for the exposure measure. That understates the ratio, because the regulatory standard is designed to ignore risk weights and show raw balance-sheet plus exposure intensity instead, as described in the HKMA implementation guidance.
For a small business buyer, that formula is useful mainly as a reminder that bank ratios and deal ratios are built for different audiences. A commercial lender underwriting an acquisition usually cares about debt to EBITDA, debt to equity, or net debt to EBITDA, not a bank's own capital position.
Why buyers should not borrow the bank model
Acquisition underwriting gets clearer when you stay on the borrower side of the table. If you are sizing a purchase loan, the useful question is how much cash flow is available after debt service, working capital swings, and any seller note or earn-out pressure. That is a different calculation from a regulatory capital test.
The practical comparison is easier to see in comparing acquisition financing structures, where the debt mix changes repayment risk and covenant room more than any bank-style capital metric would. That matters in small business deals because one structure can look safer on paper while leaving the buyer with less room for seasonality, add-backs that do not hold up, or a delayed integration plan.
If you want to stay close to how lenders read a file, use banks reviewing business loan applications as a reference point. The credit team is usually checking cash flow, collateral, debt service, and the quality of the financials, not asking the borrower to model its own regulatory capital ratio.
Normalizing Debt and EBITDA Before You Divide
Raw statements are rarely clean enough for acquisition math. The first pass at how to calculate the ratio is almost always too optimistic or too pessimistic because the balance sheet and income statement haven't been normalized for deal reality. That's where most errors happen.
Clean debt before you build the numerator
Start with interest-bearing liabilities, not every liability on the balance sheet. Trade payables, accrued expenses, and deferred revenue are usually not debt in the ratio sense, while term loans, revolvers, seller notes, equipment loans, and other borrowings generally are. In some deals, capital lease obligations also belong in the debt stack because they behave like financing, not ordinary operating payables.
Cash netting needs a separate decision. If you're calculating net debt, you subtract excess cash, but only after deciding what cash is excess and what cash is needed for payroll, seasonality, or minimum operating liquidity. If you net every dollar of cash aggressively, you can make a highly levered business look safer than it is.
Normalize EBITDA with the same discipline
EBITDA needs the same cleanup. A trailing number that includes owner salary, personal expenses, one-time legal costs, or a recent acquisition can distort the ratio badly if you don't adjust it consistently. The goal isn't to inflate earnings, it's to represent sustainable earnings that the lender or buyer can reasonably expect after close.
| Common EBITDA Add-Backs and Their Effect on Debt/EBITDA | ||
|---|---|---|
| Add-Back Category | Example | Effect on Debt/EBITDA |
| Owner compensation | Salary above market pay | Lowers the ratio if the add-back is supportable |
| Personal expenses | Vehicle, travel, or family costs run through the business | Lowers the ratio if they won't continue post-close |
| One-time legal | Transaction-specific or unusual legal spend | Lowers the ratio if truly non-recurring |
| Earn-out accruals | Contingent purchase consideration booked in earnings | Can raise or lower the ratio depending on treatment and covenant definition |
The trap is mixing a point-in-time debt balance with an unadjusted trailing-twelve-month EBITDA figure. In small businesses, that can distort the debt-to-EBITDA ratio by a full turn or more, especially when the target has strong seasonality or a recent tuck-in acquisition.
Practical rule: Normalize debt and EBITDA using the same deal logic. If you're conservative on one side and loose on the other, the ratio stops meaning anything.
For a deeper diligence workflow, the pre-transaction financial review checklist is a useful companion because the ratio should sit inside a broader financial review, not replace it.
Sector Benchmarks That Actually Matter for Buyers
A ratio without context is just a number. Two businesses can both show the same debt to EBITDA reading and feel completely different to a lender depending on margin profile, asset intensity, and working capital needs. That's why sector comparison matters more than abstract “good” or “bad” labels.
Benchmark against the business model, not the headline
Professional services businesses usually deserve a lower debt posture because they're asset-light and depend heavily on recurring client work. Light manufacturing can support more debt when equipment and plant assets back the story. eCommerce brands often sit in the middle, but inventory timing can make the ratio jump around fast. SaaS businesses are often judged on recurring revenue quality and cash conversion, while asset-heavy roll-ups can tolerate more debt if the combined platform has strong collateral and stable earnings.
The same 4.0x Debt/EBITDA can look manageable in one sector and aggressive in another. That's not a contradiction, it's the difference between a business that throws off steady cash and one that depends on quarterly conversion cycles. Banks and equity sponsors discount sectors differently because they know the same debt load doesn't behave the same way in every model.
Use the right peer set
A buyer should compare the target to businesses with similar cash flow timing, not just the same industry code. A subscription business with upfront billing behaves differently from a project business with milestone invoicing. A retailer with heavy seasonality doesn't deserve the same interpretation as a service firm with flat monthly collections.
The practical move is simple. Compare the target to peers with similar asset intensity, similar margin structure, and similar working capital pressure. If the business is asset-heavy, debt to assets may tell you more than debt to equity. If the business is more earnings-driven, debt to EBITDA will usually carry the most weight.

Worked Example on a $2M EBITDA Acquisition
A buyer looks at a target with $2 million of EBITDA and agrees to a headline valuation of 8x EBITDA. The purchase price comes out to $16 million. That is only the starting point. The key question is how the capital stack behaves once debt, equity, and any contingent pieces are layered in.
Three financing mixes change the ratio fast
In a debt-heavy structure, most of the price is funded with borrowing and the equity check stays small. The debt to EBITDA ratio climbs quickly because the numerator is large relative to the operating earnings base. Debt to equity can look even steeper if the equity contribution is thin, since a small equity base makes the ratio rise faster.
In a more balanced structure, the same deal can look cleaner. Debt to EBITDA comes down because the debt burden is lighter, while debt to capital also looks easier to defend because equity is doing more of the work. Lenders usually prefer this version when the business has seasonality, uneven collections, or customer concentration.
A mostly equity structure can make the debt-to-equity ratio look conservative on paper, but that does not automatically make it the better deal. More equity reduces financing risk, yet it can also dilute return if the business is stable and could carry more debt. The right answer depends on whether cash flow can support the structure without creating a covenant squeeze.
Earn-outs and working capital lines can move the test
Earn-outs are a classic trap because buyers treat them like “maybe” money, while lenders may still care about the obligation if it is structurally real. A working capital line can also change the picture. If that line is included in debt for covenant purposes, the pro forma debt-to-equity ratio can move above the lender's comfort zone even when the purchase debt alone looked acceptable.
That is why the pre-close work matters. A clean ratio in the teaser does not survive if the final structure includes contingent consideration, seasonal borrowing, or a revolver drawn to fund inventory. I always cross-check the purchase structure against a pre-transaction financial review checklist and a detailed financial due diligence checklist before anyone gets attached to the headline price.
The best use of this example is to swap in your own $2 million EBITDA, 8x multiple, and funding mix, then run the downside case. If the ratio breaks under a modestly weaker year, the structure needs work before the LOI goes out. Seasonal swings, earn-outs, add-backs that are only loosely documented, and cash netting assumptions all deserve a separate pass before you trust the final number.
Your Pre-LOI Leverage Checklist
Before you send the letter of intent, run the ratio check with cold eyes. Confirm which metric the lender will test, because debt to EBITDA, debt to equity, and bank math are not the same thing. Then normalize EBITDA, decide whether cash netting is fair, and make sure every debt item in the model matches the term sheet language.

A fast pre-offer routine
- Match the metric to the audience: Use the lender's definition if you're sizing debt, the buyer's definition if you're comparing deals, and the bank's regulatory ratio only for bank balance sheets.
- Normalize earnings first: Strip out obvious one-time items, owner comp distortions, and non-recurring costs before you calculate the ratio.
- Define debt tightly: Include only obligations that behave like debt, and decide up front how you'll treat cash, revolvers, and seller notes.
- Stress the downside: If the ratio only works in the base case, the structure isn't ready.
- Check seasonal timing: A quarter-end snapshot can mislead you if the business carries inventory or receivables peaks.
- Test earn-outs and add-backs separately: Don't let contingent items blur the true debt burden.
A financial ratio is a planning lens, not a verdict. If you want to sharpen the model further, use the financial due diligence checklist as your next pass so the offer is built on numbers that hold up after the excitement wears off.
If you want to get sharper on acquisition math, structuring, and diligence, Dealmaker Wealth Society teaches buyers how to read a business the way an underwriter does. Visit Dealmaker Wealth Society to build the deal skills that help you avoid bad debt and move faster on the right acquisition.
Made with Outrank tool

From the Dealmaker Blog














A Creative Business Buying Fable
