Leveraged Buyout Model Example: Step-by-Step with Numbers
Leveraged Buyout Model Example: Step-by-Step with Numbers
You've found a business you'd like to buy. The seller's price looks plausible, a lender is interested, and your spreadsheet shows an attractive return. But you still need to answer the harder question: can the business pay for the acquisition without running short of cash?
A useful leveraged buyout model example connects the purchase price, financing, operating cash flow, debt repayment, and eventual sale. The hypothetical deal below gives you a set of numbers you can rebuild in Excel or Google Sheets, then tests what changes when you're buying a small business with bank debt and uncertain seller financing.
Table of Contents
- Sources and Uses for the Example Deal
- How to Build the Model in the Right Order
- Choosing the Debt Stack and Its Terms
- Debt Paydown Schedule Year by Year
- Equity Returns and Exit Sensitivity
- Stress-Testing the Deal When Things Go Wrong
- Decide Your Structure Before You Bid
Sources and Uses for the Example Deal
Assume you're buying a business with $20.0 million of EBITDA at 8.0x EBITDA. EBITDA means earnings before interest, taxes, depreciation, and amortization. Every deal assumption below is illustrative, not a market quote or financing commitment.
Sources and uses for the $20M EBITDA example deal
| Line item | Amount ($M) and notes |
|---|---|
| Purchase enterprise value | 160.0, calculated as 20.0 × 8.0x |
| Transaction fees | 4.0, advisory, financing and legal |
| Total uses | 164.0, purchase enterprise value plus fees |
| Senior term loan | 60.0, or 3.0x entry EBITDA |
| Subordinated notes | 30.0, or 1.5x entry EBITDA |
| Sponsor equity | 74.0, approximately 45% of total sources |
| Total sources | 164.0, debt plus sponsor equity |
Read the purchase price first. Enterprise value represents the value of the operating business, not necessarily the check paid to its shareholders. For simplicity, assume a cash-free, debt-free purchase with normal working capital delivered, no existing debt to refinance, and no additional closing cash requirement.
The fees are a separate use of cash. They don't increase the operating business's purchase valuation, but someone must fund them.
The financing combines senior debt, subordinated debt, and equity from the buyer, called the sponsor. The sponsor controls a business worth more than its equity contribution, while the acquired company generates the cash needed to service acquisition debt. That arrangement can amplify gains, but lenders must still be paid when earnings disappoint.
A much more debt-financed historical example was KKR's 1988 RJR Nabisco bid, which planned to borrow approximately 87% of the purchase price, supported by the target's assets and expected earnings, according to UPI's contemporary financing report.
Set the valuation assumptions
Before forecasting, enter the assumptions that frame this hypothetical investment:
- Entry multiple: 8.0x EBITDA.
- Exit timing: The end of Year 5.
- Exit multiple: 8.0x EBITDA in the base case.
The balancing calculation is sponsor equity = total uses − debt financing. Here, that's $164.0 million minus $90.0 million, leaving $74.0 million.
First check: Sources must equal uses. If they don't, stop before building the forecast.
How to Build the Model in the Right Order
Build the business forecast before asking how much debt will make the return attractive. Otherwise, it's easy to adjust operating assumptions until the financing appears affordable.
The sequence below separates operating performance from financing decisions.
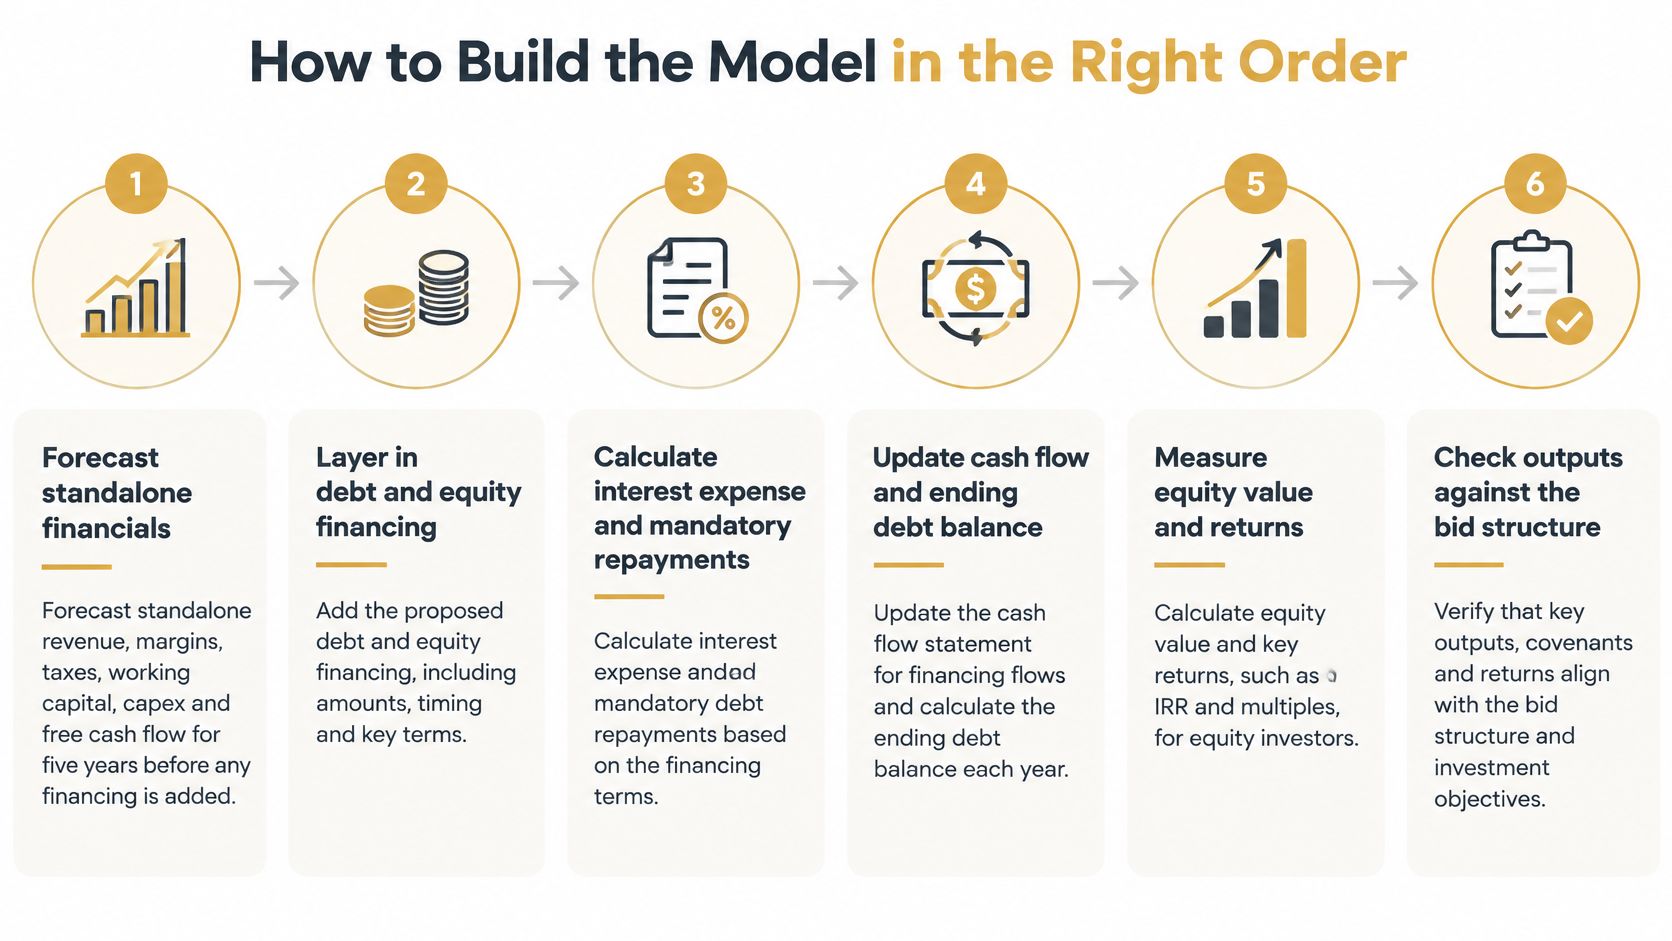
Forecast the standalone business. Project revenue, EBITDA margins, cash taxes, working capital, capital expenditures, and unlevered free cash flow across the hypothetical holding period. Start with the company's operating history, then keep proposed buyer initiatives separately identifiable.
Size the acquisition financing. Calculate entry debt, then test whether recurring cash generation can support the proposed debt. A lender's willingness to advance money isn't proof that the company can comfortably repay it.
Build contractual repayments and the cash sweep. Mandatory amortization is scheduled principal repayment; a cash sweep directs eligible surplus cash toward additional repayment. Specify the minimum operating cash balance and which obligations get paid before calculating that surplus.
Calculate exit enterprise value. Multiply terminal EBITDA by the selected exit multiple. Keep the multiple in an input cell rather than embedding it inside the formula.
Calculate sponsor proceeds. Subtract exit net debt from enterprise value, then account for any modeled selling costs or other senior claims. Don't confuse the buyer's enterprise valuation with the cash available to equity holders.
Measure returns across scenarios. Calculate money on invested capital and internal rate of return using the sponsor's actual cash-flow timing. Run base, downside, and upside cases through the entire model, not just the exit valuation.
The distinction between debt measures matters. Debt divided by enterprise value describes financing mix; net debt divided by EBITDA compares borrowing with operating earnings. The buyout capital-structure study by Brown, Harris, and Munday finds different relationships between these measures and returns, supporting the need to avoid treating them as interchangeable.
Organize a workbook you can audit
Use separate tabs named Assumptions, Sources and Uses, Operating Forecast, Debt Schedule, Returns, and Sensitivity. Give input cells a consistent color, distinguish formulas, and link calculations to their underlying assumptions.
Keep operating cash flow distinct from EBITDA:
Unlevered free cash flow = EBITDA − cash taxes − capital expenditures − increase in working capital
Then subtract cash interest to calculate cash available before principal repayments. If working capital releases cash, the working-capital adjustment becomes an inflow.
Finish with visible error checks for sources and uses, the cash roll-forward, and each debt balance. A convincing return doesn't compensate for a spreadsheet that fails to reconcile.
Choosing the Debt Stack and Its Terms
Start with how much debt the business can survive, not which lender offers the lowest rate. The hypothetical structure carries 4.5x total debt to entry EBITDA, before allowing for any cash netting.
For context, NEPC's private-markets report reports average lower-middle-market total debt multiples of 3.8x EBITDA in the first three quarters of 2025, down from 4.0x in 2021. That comparison is a prompt for closer underwriting, not a borrowing limit for this particular business.
Debt tranche terms in the example
| Tranche | Pricing (illustrative) | Repayment | Role in the model |
|---|---|---|---|
| Senior term loan | 8.0% fixed | 1% mandatory amortization plus cash sweep | Cheapest capital, first claim on cash |
| Subordinated notes | 11.0% fixed cash interest | Bullet at maturity, no sweep | Adds leverage at a higher cost |
| Revolving credit facility | Undrawn at close | Repaid first from operating cash | Covers working-capital swings |
These are hypothetical terms. Revolver commitment fees, borrowing fees, and any drawn interest would need separate inputs in a live transaction.
At opening balances, annual cash interest is:
($60.0M × 8.0%) + ($30.0M × 11.0%) = $8.1M
Opening EBITDA-to-interest coverage is therefore $20.0M ÷ $8.1M = approximately 2.47x. That's interest coverage, not debt-service coverage, because it excludes principal repayments and other cash requirements.
Compare leverage with resilience
The senior loan costs less, but the sweep repays it first. The more expensive notes remain outstanding, so the borrowing mix changes as senior debt falls.
Don't assume operational improvements will rescue an aggressive structure. A Census study of leveraged buyouts found gains sustained for approximately three years, followed by material deterioration in years four and five, when performance was no longer significantly above pre-buyout levels.
A lower-debt version removes the hypothetical subordinated notes. Sponsor equity becomes $104.0 million, approximately 63% of sources, while opening senior interest is $4.8 million, giving approximately 4.17x EBITDA-to-interest coverage.
The larger equity check reduces financial pressure, but it must still earn an acceptable return. Compare both structures using the same operating forecast, rather than giving the lower-debt alternative a more optimistic business plan.
Before accepting either proposal, understand what debt covenants require. Match the model's definitions, testing dates, and permitted adjustments to the proposed loan documents.
Borrow against recurring cash flow, not the best EBITDA number you can defend.
Debt Paydown Schedule Year by Year
For the hypothetical base case, assume EBITDA grows from $20.0 million to $30.0 million over the holding period, approximately 8.4% annually. Assume cash available for principal repayment totals $45.0 million, all applied to senior debt.
The intermediate repayments below are illustrative allocations, not outputs from a detailed operating forecast. They show the debt mechanics; an acquisition-ready model must produce them from revenue, expenses, investment needs, taxes, and interest.
Debt paydown and debt load by year
| Year | Debt paydown ($M) | Net debt / EBITDA |
|---|---|---|
| Close (Year 0) | None | 4.50x, debt 90.0 / EBITDA 20.00 |
| Year 1 | 6.0 | 3.87x, debt 84.0 / EBITDA 21.69 |
| Year 2 | 7.5 | 3.25x, debt 76.5 / EBITDA 23.52 |
| Year 3 | 8.5 | 2.67x, debt 68.0 / EBITDA 25.51 |
| Year 4 | 10.0 | 2.10x, debt 58.0 / EBITDA 27.66 |
| Year 5 | 13.0 | 1.50x, debt 45.0 / EBITDA 30.00 |
Assume no excess cash available for netting, so debt and net debt are equal here. Minimum operating cash isn't treated as distributable sale proceeds.
Read the opening repayment carefully. The $6.0 million includes mandatory amortization, rather than sitting on top of it. With annual mandatory amortization assumed at 1% of original senior principal, the scheduled payment is $0.6 million, followed by $5.4 million of additional sweep repayment.
Reconcile cash before accepting paydown
Calculate senior interest using average beginning and ending balances. In Year 1, that produces $4.56 million of senior interest, plus $3.30 million on the notes, for $7.86 million total.
To support the assumed repayment, Year 1 therefore requires:
$21.69M EBITDA − $7.86M interest − $7.83M combined cash taxes, capex, and working-capital investment = $6.00M
The combined deduction is a balancing assumption for this teaching example. Replace it with individually forecast operating lines before relying on the result. Average-balance interest can create circular formulas when interest affects the sweep, so use a transparent algebraic solution or controlled spreadsheet iteration.
Two separate changes reduce debt burden: the company repays principal and grows EBITDA. Show both in the value-creation analysis rather than attributing the entire ratio improvement to debt reduction.
At exit, senior debt is $15.0 million and the bullet notes remain $30.0 million. If cash after interest can't cover mandatory principal while preserving operating liquidity, the structure fails regardless of the projected sale price.
Equity Returns and Exit Sensitivity
The hypothetical base case produces $195.0 million of sponsor equity proceeds. That follows from selling the business for $240.0 million and repaying $45.0 million of net debt.
A sensitivity view makes the dependence on the sale valuation easier to inspect.

The valuation calculation is $30.0M exit EBITDA × 8.0x = $240.0M enterprise value. This simplified example assumes no exit fees, no interim distributions, no management dilution, and no investor-level taxes.
Money on invested capital, or MOIC, compares proceeds with the initial equity check:
MOIC = $195.0M ÷ $74.0M = 2.64x
Internal rate of return, or IRR, accounts for the holding period. With only an initial investment and a terminal payment, the calculation is:
IRR = ($195.0M ÷ $74.0M)^(1 ÷ 5) − 1 = approximately 21.4%
Separate valuation risk from operating risk
Exit multiple sensitivity and downside case
| Scenario | IRR |
|---|---|
| Exit at 6.0x, EBITDA $30.0M | 12.8%, enterprise value $180.0M, equity proceeds $135.0M |
| Exit at 7.0x, EBITDA $30.0M | 17.4%, enterprise value $210.0M, equity proceeds $165.0M |
| Base exit at 8.0x, EBITDA $30.0M | 21.4%, enterprise value $240.0M, equity proceeds $195.0M |
| Exit at 9.0x, EBITDA $30.0M | 24.9%, enterprise value $270.0M, equity proceeds $225.0M |
| Downside: flat EBITDA $20.0M, exit at 7.0x, net debt $60.0M | 1.6%, enterprise value $140.0M, equity proceeds $80.0M |
The multiple-only cases hold exit debt constant. The downside changes operating performance and debt repayment together, leaving approximately 1.08x MOIC. Returning slightly more than invested capital isn't the same as earning an attractive risk-adjusted return.
Entry pricing deserves the same scrutiny. In TXU's take-private, the investor group was paying 8.5x EBITDA, compared with an industry average of 7.9x, according to Reuters' transaction coverage. Paying a premium increases the burden on future earnings and cash generation; success doesn't necessarily require maintaining the multiple if other value drivers compensate.
For a complementary visual explanation of the mechanics, use this video.
Compare the result with your required return
IRR is a calculated outcome, not the hurdle rate you choose. Chartsy's explanation of how discount rate is measured provides useful context for distinguishing a required return from a modeled investment return.
Our discussion of the ROI of an LBO also helps connect financing choices with the buyer's equity economics.
In this base case, enterprise value increases through EBITDA growth while the exit multiple stays unchanged. Debt repayment adds further equity value. Underwrite the purchase so that a lower exit multiple can still preserve invested capital, rather than making multiple expansion essential.
Stress-Testing the Deal When Things Go Wrong
The first case to interrogate is no sale at the planned exit date. A model can show positive equity value while the business lacks the cash to repay maturing debt. Valuation isn't liquidity.
For this hypothetical stress test, assume the subordinated notes mature at the planned exit. If the actual maturity differs, move the repayment obligation to the contractual date.
Run distinct failure cases
- Case A, earnings shock: Reduce Year 2 EBITDA by an illustrative 10% from its forecast level, then assume a slow recovery. Recalculate cash taxes, interest, repayment capacity, and covenant headroom rather than cutting EBITDA only in the returns tab.
- Case B, weaker operations and valuation: Reduce the exit multiple from the hypothetical 8.0x to 7.0x and compress EBITDA margin by 200 basis points. Apply the margin reduction to forecast revenue; it's not a percentage reduction in EBITDA.
- Case C, delayed exit: Assume no sale by Year 5. Show how maturing notes are repaid, refinanced, extended, or funded with additional equity.
Case B needs a revenue forecast. Without revenue, you can't translate a margin change into an EBITDA amount accurately. Case C needs financing assumptions, including refinancing costs, available borrowing capacity, and revised debt terms.
Fixed-rate acquisition debt won't immediately become more expensive when market rates rise. Test higher rates on floating-rate revolver drawings and replacement financing instead.
Assign responsibility for operational improvements
Build the initial operating plan around identifiable actions. Give pricing to the commercial lead, procurement to the operations lead, hiring to the relevant department head, and collections and inventory management to finance and operations.
For each initiative, record its start date, implementation cost, expected cash effect, and accountable owner. Use conservative organic growth and margin assumptions in later forecast years instead of extending early improvement gains indefinitely.
Our explanation of why the cover ratio matters when doing deals provides context for assessing repayment capacity. In the workbook, use the lender's exact coverage definition rather than substituting an EBITDA-based shortcut.
Record the earliest period when each scenario breaches a covenant, creates a funding shortfall, or leaves exit equity below invested capital.
Underwriting discipline: If a credible downside case breaks the financing, reduce borrowing and test the structure again. Don't repair it by assuming a better sale.
Before committing, inspect covenant testing dates, cure rights, maturity dates, refinancing dependencies, and restrictions on distributions or additional borrowing.
Decide Your Structure Before You Bid
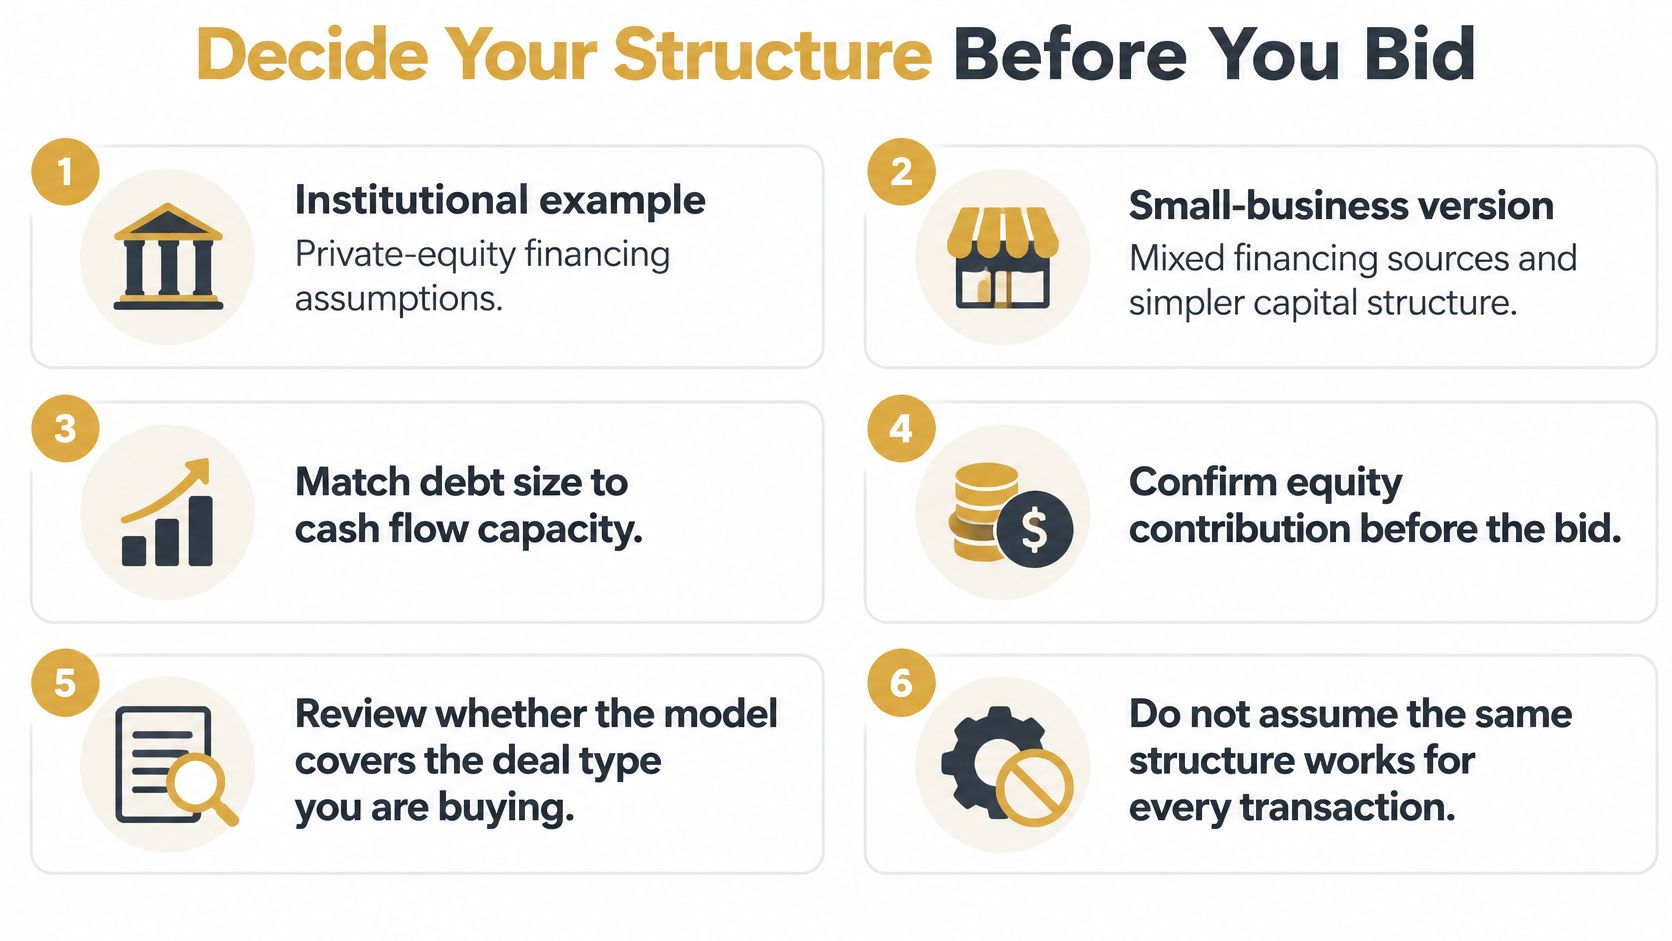
A small-business buyer can use the same modeling logic, but shouldn't copy the institutional financing package. SBA-backed lending, seller financing, and buyer equity introduce different closing conditions, repayment obligations, and personal exposure.
Analytics.loan's acquisition-market summary reports 6,910 U.S. SBA acquisition loans totaling $8.12 billion in fiscal 2025, averaging $1.18 million and representing 25.0% of 7(a) loan dollars. The same summary reports that only 19% of business owners planned to offer seller financing when exiting, making seller participation something to negotiate, not assume.
Use this checklist to distinguish the financing structures.
Make seller financing a closing test
For a smaller target, rebuild the sources-and-uses schedule with the lender-supported borrowing amount and your committed equity. The remaining funding gap is:
Required seller financing = total uses − approved acquisition debt − committed buyer equity
That's a proposed structure, not an approved one. Confirm SBA eligibility, acceptable uses of proceeds, required equity contribution, seller-note subordination or standby treatment, repayment permissions, and personal-guarantee requirements with the acquisition lender under its current rules.
Don't assume a seller note qualifies as equity or that payments can begin immediately. Put its actual permitted payments into the cash-flow schedule.
If the seller refuses financing, compare the alternatives:
- Lower purchase price: Reduce consideration until committed sources can fund the purchase and closing requirements.
- Larger equity contribution: Close the gap with verified capital, then recalculate ownership, distributions, and investor returns.
- Contingent consideration: Explore an earnout only if the lender and legal advisers confirm the proposed arrangement is permitted and workable.
An earnout isn't automatically an SBA-compatible substitute for a seller note. It also creates future payment obligations that need their own downside analysis.
Screen the business before optimizing financing
Our acquisition screen recommends only businesses that have weathered economic recessions, generate $1 million in gross revenue, and have a proven track record of steady profits. That's a starting filter, not evidence that a particular purchase price is affordable.
Before bidding, confirm committed sources, complete uses, operating reserves, lender eligibility, seller participation, guarantees, and debt-service coverage. Keep an explicit funding shortfall visible if any source remains uncommitted.
This week, rebuild the model using your own target's financial statements and proposed financing terms. Don't submit an offer based on debt or seller financing that nobody has agreed to provide.
We offer an online course on buying small businesses using M&A strategies, including debt-funded acquisitions, alongside training and mentorship on acquisition structuring. Visit Dealmaker Wealth Society to explore that support and the 10-Day Business Buying Launch, our starting point for newcomers learning to turn a potential acquisition into a workable deal.

From the Dealmaker Blog













A Creative Business Buying Fable